Did you know that 33% of financial leaders state that they need information delivery tools that allow quick data analysis? Quick access to accurate data is critical for strategic decision-making and financial success. Therefore, companies are increasingly investing in analytics tools that can help them transform unstructured ERP data into easy-to-understand recommendations that drive sound business decision-making. The tool must be quick, accurate, and simple to use and understand.
Most companies opt to make their own enterprise reporting systems using BI tools. However, this may be a more daunting task than it seems. This blog will cover the most significant challenges you might face when building your own enterprise reporting system.
Often, companies do not realize that creating a BI solution from scratch requires a massive investment of time and money.
Explore Our BI Services
There are five essential steps to building a solution that can help support enterprise reporting:
Step 1: Deploying a 3rd party connector:
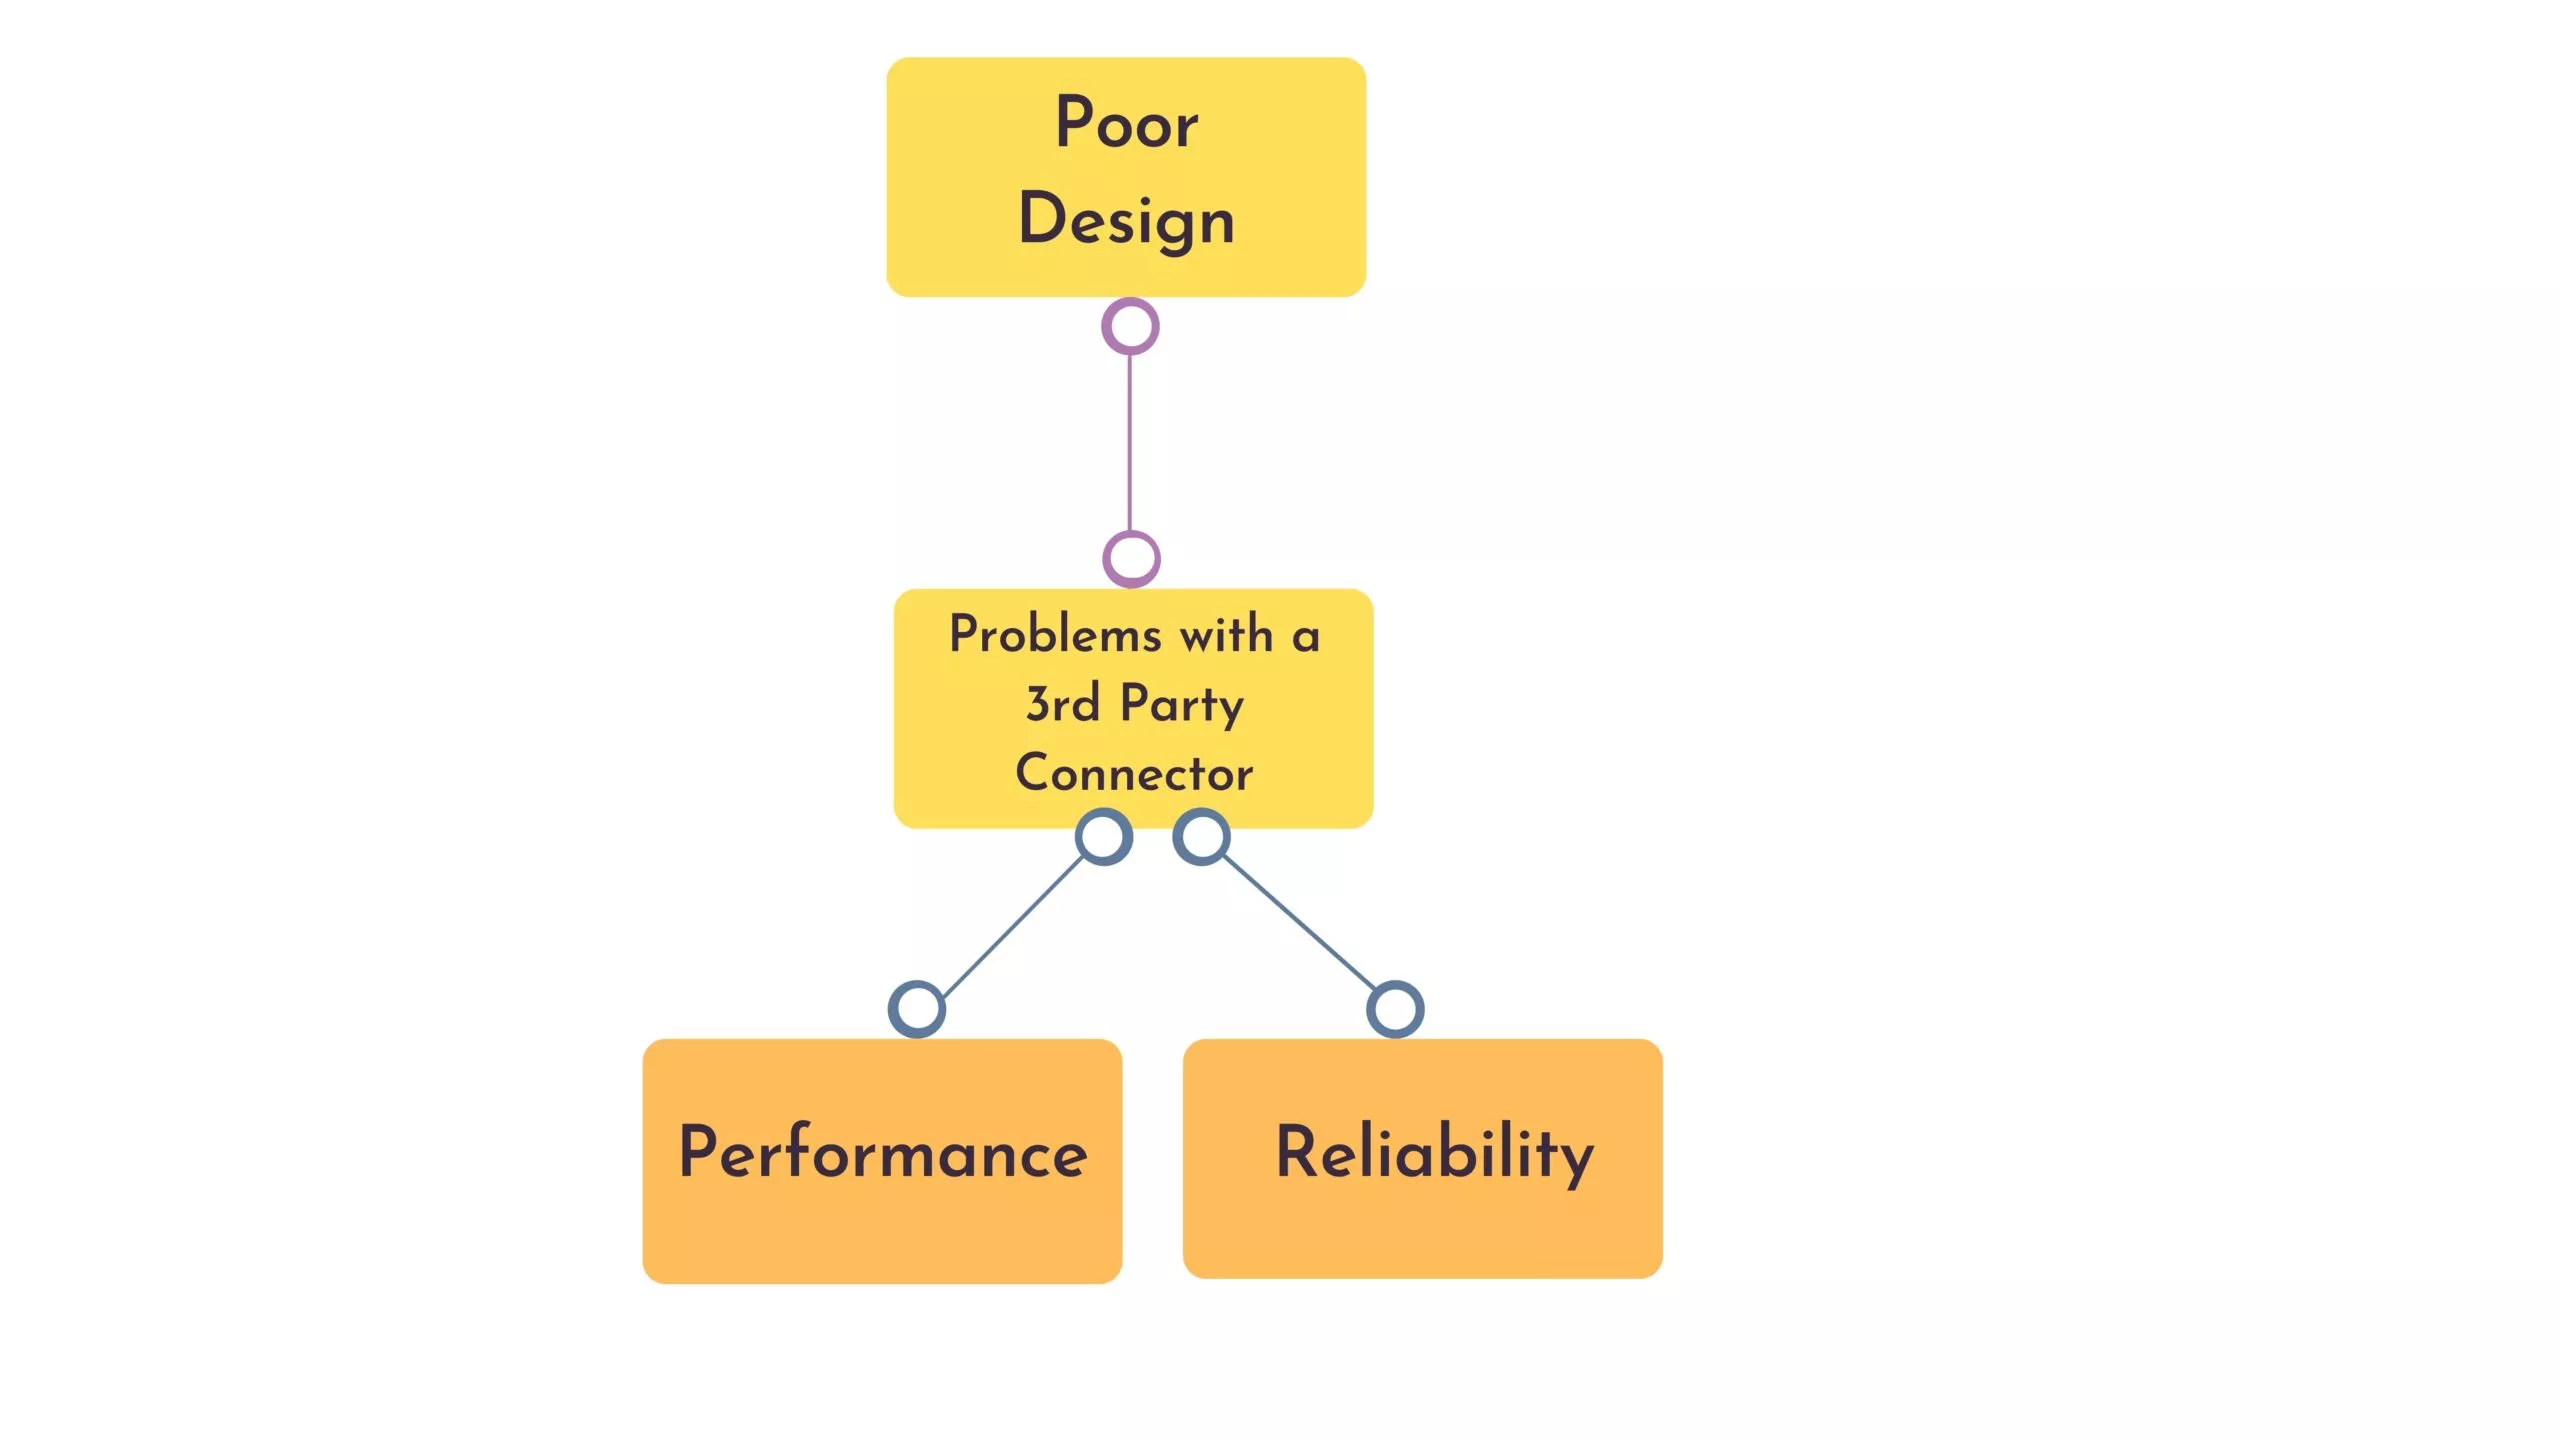
Data extraction from ERP systems is typically done through pre-built connectors. Businesses that purchase these 3rd party solutions often lack the know-how to design them for optimal performance. For instance, large amounts of data can be extracted in one go, but this can result in many memory or storage-related errors. Data engineers avoid these by implementing the best ETL (Extract, Transform, Load) practices which favor incremental data loads. Companies rarely have this in-house expertise, and they are frequently forced to look for it outside of their organization.
As ERP’s upgrade and change, data connectors must follow suit. The solution that is not able to adapt to the data object changes in ERP’s will either break or at the very least will require constant maintenance and user intervention, which can be costly.
Step 2: Data Warehousing
Next, let’s discuss data warehousing. A data warehouse is a centralized data location where organizations can store large amounts of data that has been sourced from multiple locations and systems. Data warehouses allow businesses to run quick analyses for invaluable business insights. This analysis is difficult or slow in most ERP systems, hence it must be performed externally. In addition to saving time, data warehouses provide data consistency (data from multiple sources is normalized and merged), and security (stable entities that rarely change over time).
Building a data warehouse for your solution is not a simple task, and it requires detailed planning and expert supervision.
The following are the essential steps that companies are advised to follow when conceptualizing their data warehousing:
1. Requirements Gathering – a process of aligning all departments, tools, and processes to clearly identify what reports / data need warehousing. Note, this includes planning around scalability, disaster recovery, security, and compliance.
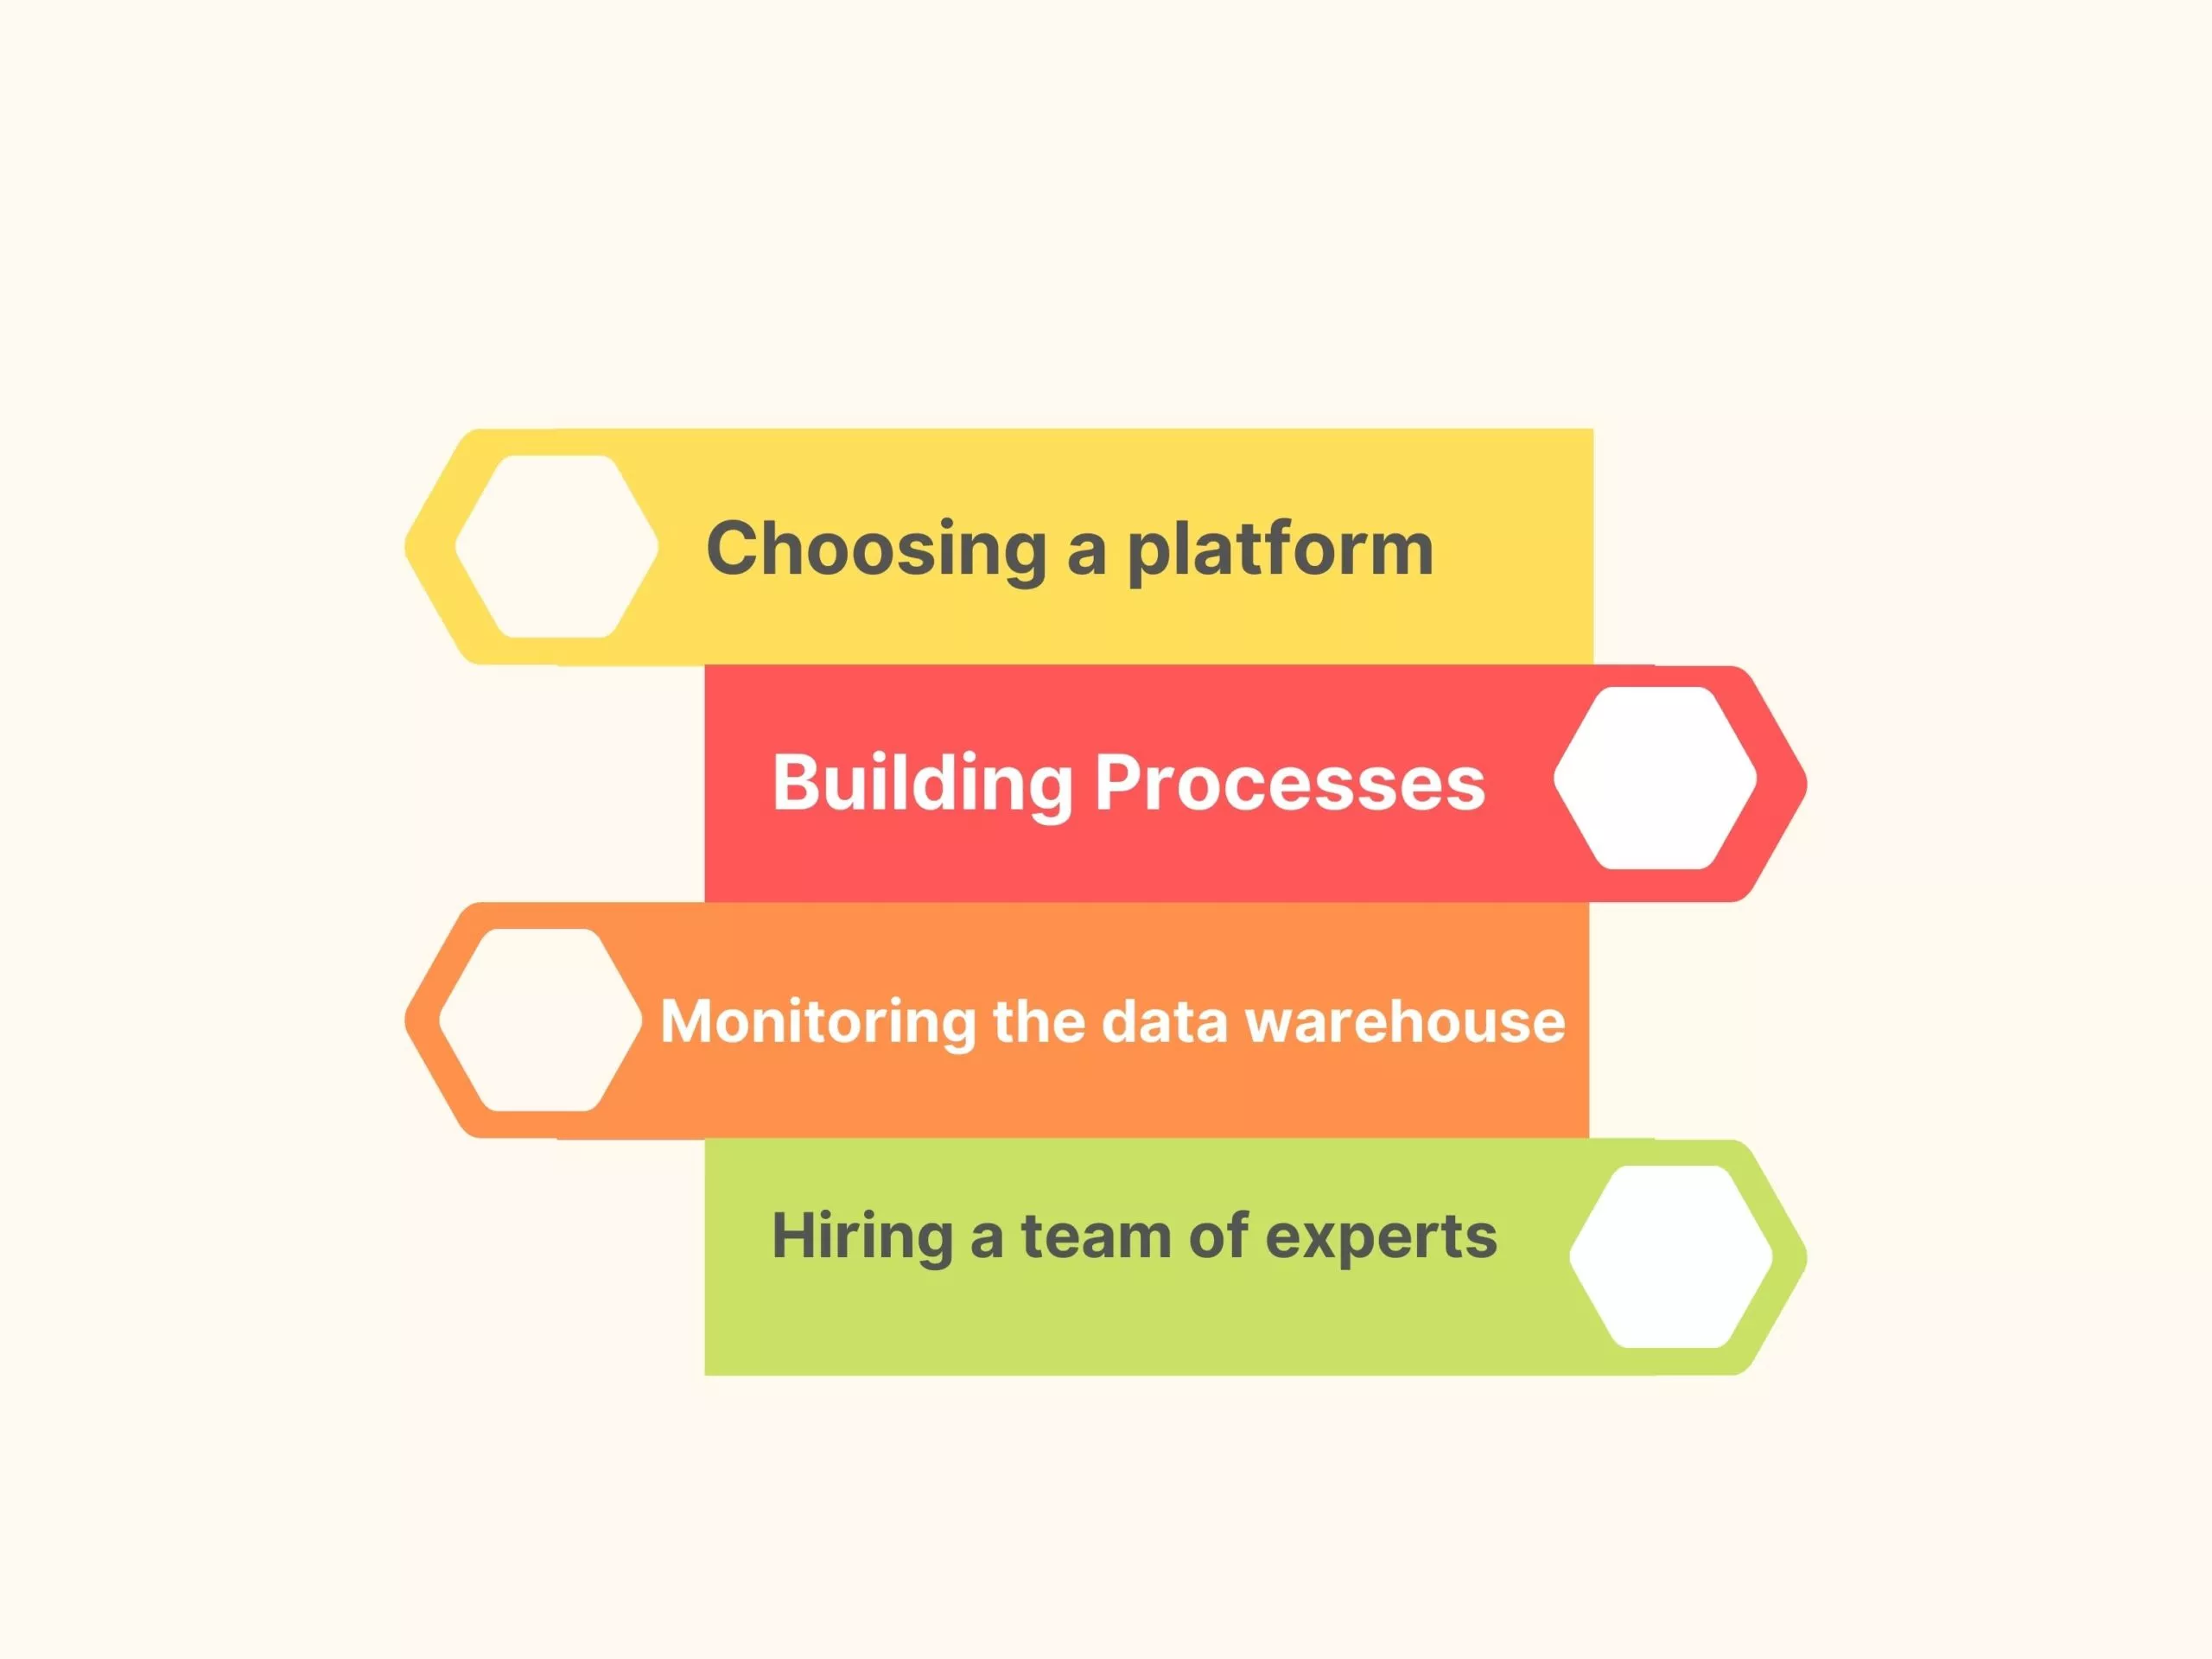
2. Engage a Team of Experts – whether you elect to use inhouse data engineers or resort to hire these externally, you will need a team of experts who will assist you with data normalization and data warehouse setup and maintenance.
3. Physical Environment(s) Setup – a decision needs to be made around environment structures which will ultimately support development cycles. Typical setup will involve development, testing, and production environments. Combining all functions into one server can result in major failures and poor performance.
4. Choose the right Extract, Transfer, Load (ETL) Solution – ETL is the process you will use to:
- pull your data from existing systems,
- make it uniform,
- and then transfer it to your data warehouse
Good ETL process / solution will make your warehouses run smoothly; by contrast, poorly defined process may make your warehouse very slow (see the article that list TOP 10 ETL tools out there).
5. Establish a monitoring process – without monitoring, you risk extracting erroneous data. Monitoring activities provide indicators that show the health of hardware and software resources. There are many tools that can be used for monitoring, and your expert team must be able to choose the one that is compatible with your technology stack.
Discover ERP Solutions
Step 3: Building the data model
A data model is the instructions for how extracted data interacts with the data warehouse. As mentioned above, before modeling can begin, a complete analysis of the organization and their reporting needs must be carried out. There are many data modeling schemas, the major types are: star, snowflake, and galaxy. It is important to note here that regardless of what schema is chosen, it must be scalable and easily extendable (support for additional data sources is a must). Furthermore, the data model must facilitate a continuous, sequential flow of transactions (data) from the ERP system to achieve reporting accuracy. Lastly, it must include handling frequent ERP updates to ensure that a connection with the source system (NetSuite) is never severed and that the data references are unchanged.
Step 4: Testing stage
Once the data modeling is completed, the testing can begin. Remember, large volumes of data coming from various data sources (ERP databases, flat files, 3PL solutions, etc.) now need to be scrutinized. The data needs to be validated for its completeness, formatting, and its integrity. There are three basic testing methods:
- Unit testing – a process of testing each component (program, procedure, scripts, shell, etc.) of the solution separately. This is typically done by developers.
- Integration testing – various components of the solution are brought together, and inputs are then validated for each module to ensure that they function correctly. The goal here is to ensure that the data across different sources was normalized correctly and that the data integrity was achieved.
- System testing – the end-to-end testing of entire system is tested using a dedicated test plan. The purpose of this testing phase is to ensure that the system is fully functional and in line with user requirements and system specifications.
Additionally, the teams will test:
- disaster recovery – needed when important components of the solution are accidentally deleted,
- operational environment – which involves testing security, schedulers, management tools, etc.
- database testing – database managers (in charge of query operations), testing of monitoring tools, database features, and lastly database performance (performance while executing a complex query)
Step 5: Build your Reports
If the solution passes the testing stage, the user can now build reports using data from the ERP solution now stored in the data warehouse. Building these reports, however, is not simple. They may require custom-written SQL formulas that calculate KPIs, parse data in a selective manner, and showcase other data interactions. Without adequate BI and ERP expertise it is difficult or nearly impossible to complete this step successfully.
What is the solution?
If reading about the process can be this exhausting, imagine having to spend hours on trying to figure out the right approach to creating your enterprise reporting system! This is why most organizations purchase pre-built BI solutions instead of building their own infrastructure from scratch. If you are still unsure, ask yourself one question before you start building your own custom reporting system: ‘Is your solution different or better than what is already available on the market? ‘
If the answer is no, you are better off buying an already built BI solution from a specialized vendor. The chances are that it will cost you less and require much less effort on your part.
AlphaBOLD’s BOLDSuite Analytics uses our proprietary data connector to pull NetSuite SuiteAnalytics Datasets and Saved Searches into your BI environment. It merges them with other external data sources and loads up-to-date data quickly while tailoring it to your exact reporting needs. With BOLDSuite Analytics, users can create immersive, interactive reports and dashboards that provide data-driven insights. Clear insights produce better business decisions, which in turn improve profitability!
Our experts have developed multiple out-of-the-box reports that cater to your many reporting needs, for example:
- The budget vs. actuals report gives users a real-time financial overview that helps you manage your day-to-day financial operations.
- The order summary report shows managers a breakdown of all the orders placed in a specific time, along with real-time inventory tracking, order rate calculation, net amount vs. quantity billed comparison.
The sales commission report can automate monthly sales commissions, get an executive view of total sales done by day/ month/ quarter/ year, and track total sales summary by the customer by the sales rep with commission details.
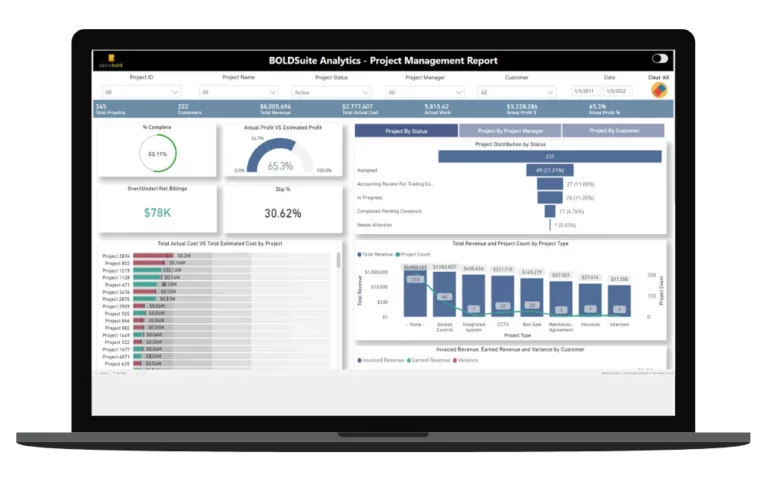
- The project management report provides users with a complete breakdown of complex project data with drill-down charts and graphs. It allows them to track outcomes in real-time for faster decision making, keeping projects on schedule and budget, and analyzing data to understand specific patterns and trends.
Conclusion:
As seen above, building an enterprise reporting system can be a time-intensive and costly proposition. The pros of pre-built external solutions will often outweigh the benefits of building your own. If you need a quick way out of this conundrum, reach out to us to learn more about BOLDSuite Analytics!


