Table of Contents
Introduction
Many organizations use Google Analytics 4 to track digital performance, but the platform alone often falls short of business-ready reporting. Marketing teams may understand user behavior, campaign engagement, and conversions, but leadership often needs a broader view that connects website activity to revenue, sales pipeline, customer journeys, and business outcomes.
By integrating Google Analytics with Power BI, businesses can connect web performance with CRM, ERP, advertising, sales, and finance data. This enables deeper analysis, stronger reporting models, and more informed decision-making.
This guide explains how to connect Google Analytics with Power BI, the common GA4 connector challenges, and the best practices for building a reliable reporting pipeline. It also covers 2026 considerations such as Consent Mode, Microsoft Fabric, BigQuery, and data quality.
By integrating Google Analytics with Power BI, businesses can connect web performance with CRM, ERP, and advertising data. This enables deeper analysis, predictive modeling, and strategic decision-making.
This guide outlines the steps, challenges, and best practices for building a robust Google Analytics to Power BI pipeline that supports enterprise-level reporting and scale.
Why Power BI Is Essential for Strategic Insights?
Microsoft Power BI is a unified analytics platform that consolidates data from multiple sources such as Excel, SQL Server, SharePoint, Azure, and more.
Unlike static reporting tools, the platform enables users to:
- Build interactive dashboards with filters, slicers, and drill-down capabilities
- Clean and model complex datasets using Power Query and DAX
- Create advanced KPIs by linking multiple datasets across business functions
This transforms Power BI from a visualization tool into a platform for operational intelligence.
Power BI has become a widely used analytics platform for organizations that need to connect data preparation, modeling, visualization, and business reporting in one Microsoft environment. Its adoption across more than 375,000 organizations and 30 million monthly active users reflects its role in modern business intelligence.
Why GA4 Alone Is Not Enough for Enterprise Reporting
Google Analytics 4 helps teams understand website traffic, campaign engagement, events, and conversions. However, it does not automatically connect that activity to CRM opportunities, sales pipeline, customer lifetime value, finance data, or operational performance.
For example, GA4 can show which campaign generated form submissions. But leadership often needs to know which forms became qualified leads, which campaigns influenced revenue, and how website activity connects to the sales cycle.
Power BI Connects Web Analytics with Business Data
Power BI helps teams bring GA4 data into a broader reporting view by combining it with CRM, ERP, advertising, sales, and finance data. This turns website metrics into business-ready insights, such as campaign ROI, pipeline influence, revenue attribution, and customer journey performance.
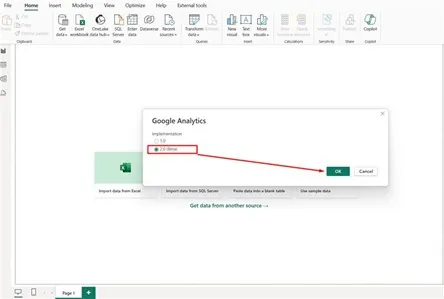
The Power Query Google Analytics connector supports GA4 through Implementation 2.0 Beta, which uses the Google Analytics Data API.
Fabric Adds a Scalable Data Foundation
For Microsoft-first organizations, Microsoft Fabric can support a more centralized analytics workflow. Fabric Dataflow Gen2 can connect to Google Analytics, prepare and transform the data, and make it easier to combine web analytics with other business systems before reporting in Power BI.
This gives teams a cleaner path for governed, reusable, and cross-functional reporting instead of building isolated GA4 dashboards.

How to Integrate Google Analytics with Power BI Step by Step?
Step 1: Open Power BI Desktop
If you haven’t already, download and install Power BI Desktop. This free tool is essential for creating and managing reports.
Step 2: Connect to Google Analytics
- Open Power BI Desktop.
- Navigate to Home > Get Data
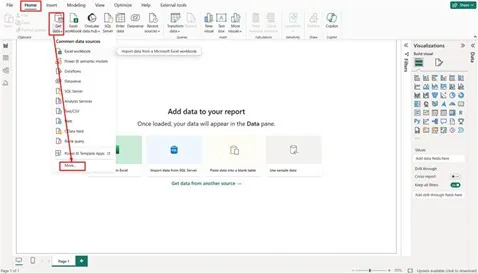
- Search for and select Google Analytics.
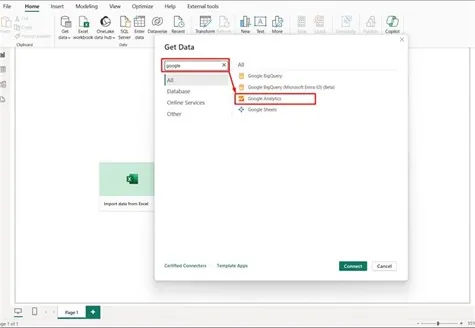
- Click Connect.
Step 3: Authenticate Your Google Account
- Sign in using your Google credentials.
- Allow Power BI to access your Google Analytics account.
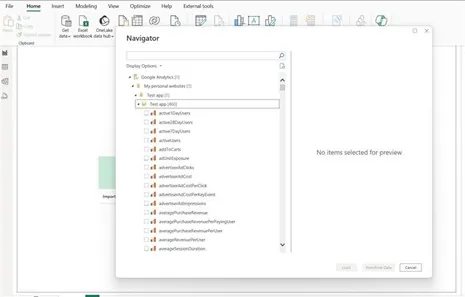
Step 4: Select Data Hierarchy
For GA4, select the relevant account and property, then choose the dimensions, metrics, events, and conversions needed for reporting.
Step 5: Load or Transform Data
- Click Load to import raw data.
- Click Transform Data to clean and reshape data before reporting.
Use Power Query to remove duplicates, apply filters, and rename technical fields for clarity.
Further Reading: Integrating Power BI: Merging with Your Infrastructure
What Are the Challenges with the GA4 Connector in Power BI?
Power BI supports GA4 through the Google Analytics Data API using the Power Query Google Analytics connector’s Implementation 2.0 Beta option. This allows teams to connect GA4 data directly to Power BI, but the connector still has limitations that can affect reporting performance and flexibility. Microsoft’s documentation also notes that Universal Analytics support uses the older Implementation 1.0 setting, while GA4 scenarios use Implementation 2.0.
Common challenges include:
- Slow data loading when handling large GA4 datasets
- Limited control over start and end dates during setup
- More complex dynamic filtering requirements
- Need for Power Query skills to shape, filter, and optimize the data
- Possible API quota or performance issues when reports pull large or complex datasets
For simple GA4 reporting, the native connector may be enough. However, teams that need scheduled refreshes, larger datasets, multi-channel marketing reporting, or more stable data pipelines may benefit from third-party connectors like Supermetrics, Funnel, or Analytics Canvas. Enterprise teams may also consider BigQuery or Microsoft Fabric-based workflows when GA4 data needs to be combined with CRM, ERP, sales, or finance data.
How Consent Mode Affects GA4 Reporting Accuracy
GA4 reporting depends on how user consent, tags, and conversion tracking are configured. If visitors decline consent or tags do not fire correctly, GA4 may have less observed data available for reporting.
This matters because Power BI dashboards built from GA4 data will reflect the same gaps. Starting June 15, 2026, Google Analytics will use Consent Mode within Google Ads as the single control for certain data collection and use, making consent setup more important for Analytics and Ads reporting workflows.
Before connecting GA4 to Power BI, teams should review their consent banner, tag firing rules, conversion setup, and Google Ads/GA4 consent configuration. This helps prevent incomplete or modeled data from being treated as final performance reporting.
Which GA4 to Power BI Integration Option Is Right for You?
Not every Google Analytics Power BI integration needs the same setup. A small marketing team may only need a basic GA4 dashboard with sessions, users, conversions, and campaign performance. A larger organization may need raw event-level data, CRM joins, revenue attribution, and scheduled refreshes across multiple reporting layers.
The right integration method depends on your reporting complexity, data volume, refresh requirements, and whether your team needs summarized GA4 data or a more scalable analytics pipeline.
| Integration Option | Best For | Limitation |
|---|---|---|
|
Native Power BI GA4 connector |
Basic GA4 dashboards |
Beta limitations and query complexity |
|
Third-party connector |
Faster marketing reporting setup |
Added subscription cost |
|
GA4 to BigQuery to Power BI |
Raw event-level and enterprise analysis |
Requires SQL and data engineering |
|
Fabric Dataflow Gen2 |
Microsoft-first centralized analytics |
Best for broader data preparation workflows |
For basic dashboards, the native Power BI connector may be enough. For marketing teams that want quicker setup and less manual configuration, a third-party connector can simplify reporting. For enterprise reporting, especially when GA4 data needs to be combined with CRM, ERP, sales, or customer data, BigQuery or Microsoft Fabric-based workflows offer a stronger foundation for scalable analytics.
This decision matters because the integration method affects more than setup time. It also affects refresh reliability, data granularity, reporting flexibility, and how easily teams can connect website activity to pipeline, revenue, and customer behavior.
Align Your Marketing, Sales, and Customer Data for Actionable Insights
AlphaBOLD designs custom business intelligence solutions that connect marketing, sales, finance, and operational data into reporting models your teams can trust.
Request a ConsultationData Quality Checklist Before Connecting GA4 to Power BI
Before connecting GA4 to Power BI, teams should confirm that the source data is accurate, consistent, and ready for reporting. A dashboard is only useful if the data behind it is clean and aligned with business definitions.
Use this checklist before building your Google Analytics Power BI integration:
- Confirm that GA4 events and conversions are configured correctly.
- Standardize UTM naming across campaigns, channels, and paid media sources.
- Validate consent mode, cookie settings, and tag firing rules.
- Check whether the required GA4 dimensions and metrics are compatible in the same query.
- Decide whether the report needs summarized GA4 data or raw event-level data.
- Align GA4 conversions with CRM opportunity, pipeline, and revenue fields.
- Define refresh frequency, dashboard ownership, and data validation responsibilities.
This step helps reduce reporting errors before they reach Power BI. It also gives marketing, sales, and leadership teams more confidence that website activity is being connected to the right business outcomes.
Further Reading: Understanding Power BI Licensing
What are the Best Practices for Effective GA to Power BI Integration?
Follow these best practices to keep your Google Analytics Power BI integration reliable, scalable, and useful for business reporting:
- Use the right connector based on reporting complexity: Choose the native GA4 connector, third-party tools, BigQuery, or Microsoft Fabric based on your data volume, refresh needs, and reporting goals.
- Apply Power Query transformations before modeling: Clean, filter, rename, and shape GA4 data before building visuals so reports are easier to understand and maintain.
- Limit query size to improve refresh performance: Keep GA4 queries focused by selecting only the dimensions and metrics required for the report. This helps reduce loading delays and performance issues.
- Rename fields using business-friendly labels: Replace technical GA4 field names with clearer labels, such as “Website Users,” “Campaign Source,” or “Conversions,” so business users can understand the dashboard quickly.
- Use DAX to create business KPIs: Build calculated measures such as cost per acquisition, conversion rate, session-to-sale ratio, revenue attribution, and campaign ROI.
- Combine GA4 with CRM, ERP, and ad platform data: Connect website activity with pipeline, revenue, customer records, and campaign spend to create a complete view of marketing performance.
- Define refresh frequency and ownership: Decide how often the dashboard should refresh and who is responsible for validating the data, maintaining the model, and updating reporting logic.
Further Reading: Optimizing DAX Queries for Power BI Performance
Integrate, Model, And Visualize GA And Business Data in Power BI
Combine Google Analytics with your CRM, ERP, and advertising data in Power BI for real-time insights, interactive dashboards, and data-driven decisions that enhance marketing performance and ROI.
Request a ConsultationFinal Thoughts
Google Analytics provides valuable digital performance data, but its full value comes when that data is connected to the broader business environment. Power BI helps teams combine GA4 data with CRM, ERP, advertising, sales, and finance data to create more useful reporting.
For 2026 and beyond, teams also need to consider connector limitations, Consent Mode, data quality, BigQuery, and Microsoft Fabric when building a reliable GA4 reporting pipeline. With the right architecture, organizations can move from isolated website metrics to scalable, business-ready analytics that connect marketing activity to pipeline, revenue, and customer behavior.
FAQs
Integrating GA4 with Power BI helps teams connect website activity with broader business data. Instead of only tracking sessions, events, and conversions, organizations can combine GA4 data with CRM, ERP, advertising, sales, and finance data to understand campaign ROI, pipeline influence, revenue attribution, and customer journey performance.
Power BI supports GA4 through the Power Query Google Analytics connector’s Implementation 2.0 Beta option. However, teams may face slow loading with large datasets, limited setup flexibility for date ranges, complex filtering requirements, and possible API quota or performance issues. For larger reporting needs, teams may need third-party connectors, BigQuery, or Microsoft Fabric-based workflows.
Third-party connectors are not always necessary. The native Power BI GA4 connector may work for basic dashboards and smaller datasets. However, third-party tools like Supermetrics, Funnel, or Analytics Canvas can be useful when teams need scheduled refreshes, easier setup, multi-channel marketing data, or more stable reporting pipelines.
Use the native GA4 connector for basic dashboards and smaller datasets. Use a third-party connector when marketing teams need faster setup and easier scheduled reporting. Use BigQuery when you need raw event-level GA4 data, advanced attribution, CRM joins, historical analysis, or enterprise-scale reporting. Microsoft Fabric can also support Microsoft-first teams that want a centralized data preparation layer before Power BI reporting.
Microsoft Fabric can support a more centralized analytics workflow by helping teams connect, prepare, and transform Google Analytics data through Dataflow Gen2. This makes it easier to combine GA4 data with CRM, ERP, sales, finance, and operational data before visualizing it in Power BI.
Yes. Consent Mode can affect what GA4 captures and reports. If visitors decline consent or if tags are not firing correctly, GA4 may have less observed data available. Since Power BI dashboards use the data pulled from GA4, those same gaps can appear in final reports. Teams should review consent settings, tag firing rules, and conversion tracking before building GA4 Power BI dashboards.
Power BI can use Power Query and DAX to clean, model, and calculate business KPIs from GA4 data. Teams can create measures such as conversion rate, cost per acquisition, session-to-sale ratio, campaign ROI, revenue attribution, and pipeline influence by combining GA4 data with CRM, ERP, advertising, and sales data.
Explore Recent Blog Posts