
Table of Contents
Introduction
This article is designed to provide C-level executives with an understanding of Power BI’s data integration capabilities, illustrating how they can connect data sources to Power BI, drive strategic decision-making, and provide competitive advantages.
Did you know that current data on business intelligence reveals that approximately 66% of employees globally have access to at least one business intelligence tool? When considering broader data analytics software, this figure rises to 75%. This widespread adoption underscores the unparalleled efficiency of Power BI in converting complex data into insightful, actionable information.
Therefore, the secret behind this successful adoption is the exceptional Power BI data integration capabilities that make decision-making and reporting much easier.
The Strategic Value of Power BI Data Integrations
Power BI’s ability to integrate a diverse array of data sources is at the forefront of its appeal for executives. It’s not just about data connection; it’s about transforming data into strategic insights. This feature is crucial for leaders who need a comprehensive, real-time view of their business to make informed decisions.
Key Data Sources and Their Strategic Importance:
- Databases: Integrations with SQL Server, MySQL, Oracle, and more, are essential for leaders to have real-time access to operational data for prompt and informed decision-making.
- Cloud Services: Integration with services like Azure, Salesforce, and Google Analytics provides executives with a holistic view of their business operations and customer interactions.
- Files and Spreadsheets: The ability to integrate with Excel, CSV, XML, and other formats ensures a complete data picture is available for high-level analysis.
- Other Sources: Including web APIs, SharePoint, and streaming data, broadens the executive’s view, enabling agile responses to market changes.
Benefits of Power BI Integrations:
- Holistic Business View: Integrating various data sources allows for a more comprehensive understanding of the business, essential for strategic planning.
- Timely Insights: The capability for real-time analysis is crucial for dynamic business environments where rapid decision-making is key.
- Customization and Flexibility: Power BI enables tailored reports and dashboards to meet specific strategic needs.
- Ease of Use: Its intuitive interface allows executives to grasp key insights without deep technical expertise.
Getting Started with Data Integrations:
For executives looking to leverage Power BI, Microsoft offers detailed guides and documentation. These resources are invaluable for understanding how to integrate various data sources into Power BI for strategic benefit.
- For a detailed guide on connecting to data sources in Power BI, visit Power BI data sources.
- To learn about integrating specific types of data sources, Microsoft’s Power BI documentation offers a wealth of information, accessible here.
What's New in Power BI: 2026 Revolutionary Updates
1. Copilot for Power BI: AI-Powered Analytics at Your Fingertips
The Game Changer: Power BI’s Copilot has evolved from a basic Q&A tool to a comprehensive AI assistant that fundamentally changes how business users interact with data.
What’s New in 2025-2026:
- Standalone Copilot Experience: Now generally available, users can access any data across their organization through a full-screen, conversational interface accessible directly from the Power BI navigation—no need to open specific reports first.
- DAX Query Generation (Generally Available): Copilot can now write complex DAX queries based on natural language requests. Simply ask “What’s our year-over-year growth in the Northwest region?” and Copilot generates, executes, and explains the DAX query needed to answer your question.
- Context-Aware Intelligence: Copilot understands your semantic models, including table relationships, measure descriptions, and business context, delivering accurate, grounded responses rather than generic answers.
- Report Generation: Create entire report pages in seconds by describing what you need. Copilot generates visualizations, layouts, and even suggests additional insights based on your data.
- Intelligent Filtering: Copilot automatically applies contextual filters to queries, even when not explicitly stated, ensuring accurate results without manual navigation.
Strategic Impact: Companies using Copilot report 60-70% reduction in time spent on routine analytics tasks, freeing analysts to focus on strategic insights rather than data wrangling.
Executive Takeaway: Copilot democratizes analytics across your organization. Non-technical users can now ask sophisticated business questions and receive accurate, visual answers instantly reducing dependency on specialized BI teams and accelerating decision-making cycles.
2. Microsoft Fabric Integration: Unified Data Architecture
The Game Changer: Power BI is now deeply embedded within Microsoft Fabric, Microsoft’s unified data platform that combines data lake, data warehouse, and analytics into a single ecosystem.
What’s New in 2025-2026:
- Direct Lake Mode: Analyze massive datasets (petabytes) with near-instantaneous performance by loading Parquet files directly from OneLake into memory—no data import or duplication required. Direct Lake combines the speed of Import mode with the freshness of DirectQuery.
- Lakehouse Integration: Connect to multiple Fabric lakehouses and warehouses within a single semantic model, breaking down data silos and enabling comprehensive, cross-source analysis.
- OneLake Data Hub: Access all organizational data through a centralized hub, with Power BI seamlessly discovering and connecting to datasets across your Fabric environment.
- Dataflows Gen2: Enhanced ETL capabilities with better performance, more connectors (200+), and seamless integration with Fabric’s lakehouse architecture for large-scale data transformation.
- Real-Time Streaming: Ingest and analyze streaming data from Fabric Eventstreams directly into Power BI reports, enabling live operational dashboards and immediate response to business events.
Strategic Impact: Organizations implementing Fabric with Power BI report 40-50% reduction in data management costs and up to 10x performance improvements for large-scale analytics.
Executive Takeaway: Fabric represents a strategic shift from fragmented data infrastructure to a unified platform. This consolidation reduces complexity, eliminates data duplication, and provides a single source of truth that scales with your business—critical for AI-driven insights and enterprise-wide analytics.
3. Enhanced Calendar-Based Time Intelligence :
The Game Changer: Custom calendar support transforms how organizations handle fiscal years, retail calendars, and week-based reporting.
What’s New in 2025-2026:
- Custom Calendar Definition: Define fiscal years, 4-5-4 retail calendars, or any custom period structure directly in your data model without complex DAX workarounds.
- Week-Based Calculations: Perform accurate week-over-week analysis with proper week-based time intelligence functions that respect your organization’s calendar structure.
- Simplified DAX: Time intelligence calculations that previously required 50+ lines of complex DAX can now be accomplished with simple, maintainable formulas.
Strategic Impact: Finance and retail organizations can now align reporting with their business calendars without extensive custom development, reducing report building time by 30-40%.
Executive Takeaway: Your reports can finally align with how your business actually operates whether that’s fiscal quarters, retail periods, or custom business cycles—without requiring specialized technical expertise.
4. Advanced Data Modeling Capabilities:
What’s New in 2025-2026:
- DAX User-Defined Functions (UDFs): Create reusable, parameterized functions that standardize complex calculations across your organization, ensuring consistency and reducing maintenance overhead.
- Visual Calculations: Define calculations directly within visuals without modifying the underlying data model, enabling rapid, ad-hoc analysis for business users.
- Enhanced Composite Models: More flexible DirectQuery integration allows mixing Import, DirectQuery, and Direct Lake modes within the same model for optimal performance and data freshness.
- TMDL (Tabular Model Definition Language): Advanced code editing with IntelliSense, context tooltips, and professional development tools for power users and developers.
Executive Takeaway: These modeling enhancements reduce technical debt, improve governance, and enable faster, more reliable report development across your BI team.
5. Translytical Task Flows: From Insights to Action
The Game Changer: Power BI now enables users to take action directly from reports updating records, triggering workflows, and automating processes without leaving the analytics environment.
What’s New in 2025-2026:
- User Data Functions: Powered by Fabric, users can write data back to sources, update records, and trigger external workflows directly from Power BI reports.
- Automated Notifications: Configure dynamic alerts and notifications based on data conditions, keeping stakeholders informed without manual monitoring.
- Cross-System Integration: Trigger workflows in other systems (CRM, ERP, marketing automation) based on insights discovered in Power BI.
- Strategic Impact: Organizations report 50% reduction in time from insight to action, as users can respond to data-driven findings immediately rather than switching between multiple systems.
Executive Takeaway: Power BI transforms from a passive reporting tool to an active operational platform where insights automatically drive business processes and decisions.
Power BI 2026: What's Coming Next
Key Deprecations and Changes:
- Office Online Server Retirement (December 2026): Organizations using Power BI Report Server to host Excel workbooks will need to transition to alternative solutions by late 2026.
- 32-Bit Build Deprecation: As of August 2025, only 64-bit Power BI Desktop receives updates and support, providing better performance, security, and feature compatibility.
- Bing Maps to Azure Maps Migration: Power BI is transitioning from Bing Maps to Azure Maps for all mapping visualizations, ensuring continued support and access to latest geospatial features.
Licensing Evolution:
Pricing Adjustments (Effective April 2025):
- Power BI Pro: $14/user/month (up from $10)
- Power BI Premium Per User: $24/user/month (up from $20)
What You’re Getting: These increases reflect substantial platform investments including Copilot capabilities, Fabric integration, enhanced performance, and new AI-driven features that significantly expand Power BI’s value proposition.
Strategic Recommendation: Organizations should audit current licensing, assess which users truly need Pro/PPU capabilities, and explore bundled options like Microsoft 365 E5 which includes Power BI Pro.
Best Practices for Power BI Data Integration
Strategically Plan Your Data Model:
- Understand Your Data from a Business Perspective: Before integration, executives should comprehend the strategic value of their data, including its source, format, and how it will be used to drive business decisions in Power BI.
- Design for Efficiency and Scalability: An effective data model goes beyond technicalities; it’s about creating data relationships that support business strategies and optimizing data tables for future growth and performance.
- Leverage Fabric Lakehouse Architecture (2025-2026): Consider implementing a medallion architecture (Bronze-Silver-Gold layers) within Fabric to organize raw data, cleansed data, and analytics-ready data for optimal performance and governance.
Prioritize Data Cleanliness for Decision Accuracy:
- Emphasize Data Quality for Reliable Insights: Ensuring data cleanliness is paramount for C-level decision-making. Executives must ensure that data integrated into Power BI is accurate and consistent to avoid strategic missteps.
- Leverage Power BI Tools for Data Preparation: Utilizing Power BI’s data transformation features and Dataflows Gen2 should be seen as an investment in the reliability of business intelligence.
- Implement AI-Assisted Data Preparation: Use Copilot to identify data quality issues, suggest transformations, and validate data integrity automatically.
Balance Data Refresh and Real-Time Integration with Business Needs:
- Determine Refresh Rates Strategically: Executives must decide on real-time data needs versus periodic refreshes based on business priorities and operational demands.
- Leverage Direct Lake for Real-Time Performance: For large-scale, frequently updated data, Direct Lake mode provides near-real-time insights without traditional refresh overhead.
- Manage Data Volume for Optimal Performance: Overseeing data volume is crucial to avoid system overloads and ensure that performance meets business requirements.
Ensure Data Security at the Executive Level:
- Implement and Oversee Security Protocols: Data security, especially when handling sensitive or confidential information, must be a top priority for C-level executives.
- Control Data Access: Use Power BI’s security features including row-level security (RLS), object-level security, and Fabric workspace permissions to maintain strict access controls, aligning with organizational data governance policies.
- Leverage Fabric’s Unified Security Model: Take advantage of OneLake security features that propagate access controls consistently across all Fabric experiences, reducing security fragmentation.
Optimize for Organizational Performance:
- Monitor and Enhance Performance Regularly: Regular monitoring of Power BI reports and dashboards is essential for maintaining alignment with business goals. Power BI Service now includes Performance Analyzer in web for post-publication optimization.
- Optimize Data Queries for Business Efficiency: Ensuring that data queries are optimized for speed and efficiency is crucial for maintaining a competitive edge. Leverage Direct Lake mode for large datasets and use visual calculations for ad-hoc analysis.
Prepare Data for AI (Critical for 2025-2026):
- Invest in Semantic Model Preparation: For Copilot to deliver accurate, business-relevant insights, semantic models must be properly prepared with clear descriptions, hierarchies, and business context.
- Set AI Instructions: Define organization-specific guidelines, examples, and verified answers to ensure Copilot responses align with your business terminology and standards.
- Enable “Prep for AI” Features: Use Power BI’s built-in tools to mark items as ready for AI consumption and validate that Copilot has appropriate context for your data.
Maintain an Updated Knowledge Base:
- Commit to Ongoing Learning: Stay abreast of the latest Power BI features and best practices to continually enhance business intelligence capabilities. With monthly feature releases, continuous learning is essential.
- Partner with Experts: While Microsoft Direct Support offers standardized solutions directly from Microsoft, Power BI solution partners, like AlphaBOLD, offer a more personalized approach often tailored to the specific challenges and nuances unique to each business.
For more insights, read our blog: Microsoft’s Support for Power BI: What Can You Expect?
Enhance your Data Strategy with Advanced Power BI Techniques!
Step into the future of data analysis with AlphaBOLD’s comprehensive Power BI services. Let us help you explore cutting-edge integrations and analytical methods so you can improve your business insights!
Let's Talk to ExpertHow to Integrate Multiple Data Sources in Power BI
Integrating multiple data sources in Power BI is more than a technical process; it’s a strategic step towards comprehensive business intelligence that empowers C-level executives with deeper insights. This guide, while technically detailed, is framed to underscore the strategic value of each step in the data integration process.
Step 1: Connect to Data
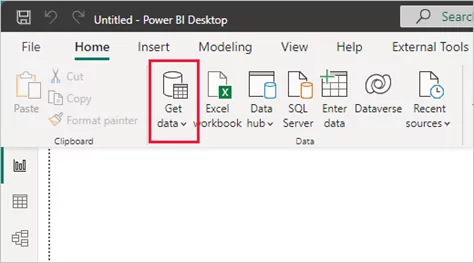
- Open Power BI Desktop: Start by opening the latest version of Power BI Desktop. For executives, staying updated with the latest version means leveraging the most advanced features for data analysis.
- Select Get Data: This is where the journey of transforming data into strategic insights begins. From the Home ribbon, click ‘Get Data’ to access a wide range of sources.
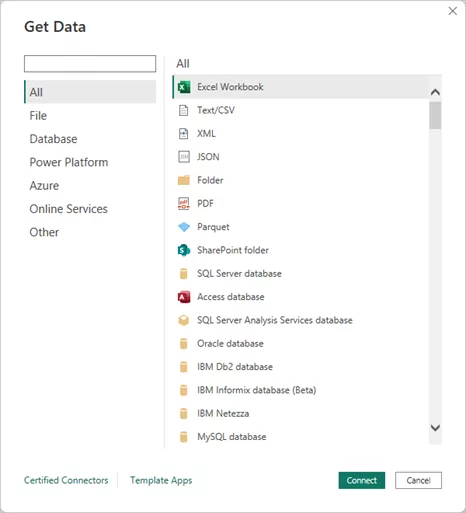
- Choose Your Data Source: For this example, we’ll use an Excel file. Select ‘Excel’ from the list of data sources in the ‘Get Data’ window and then click ‘Connect.’
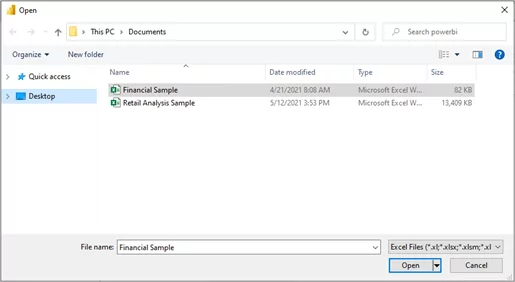
Step 2: Provide Data Source Location
- Locate Your Excel File: Navigate and connect to your Excel file (e.g., ‘Financial Sample’). This step signifies the integration of financial or operational data, foundational for strategic analysis.
You may also like: Power BI Executive Dashboards for Data-Driven Leadership
Step 3: Load Data Using Navigator
- Load Workbook Contents: Power BI Desktop will load the workbook and display its contents in the Navigator window. Here, you can select which data you wish to load into Power BI Desktop. Check the boxes next to the tables you want to import.
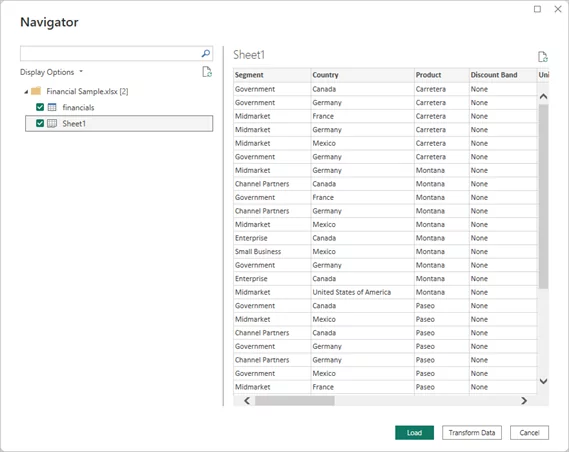
- Finalize Data Import: After selecting the desired tables, click ‘Load’ to import the data into Power BI Desktop.
Step 4: View Data in the Fields Pane
- Explore Your Data: The Fields pane gives a snapshot of the data now available for analysis. For a C-level executive, this is where data starts to transform into actionable insights.
Step 5: Repeat for Additional Data Sources
- Integrate More Data: To build a comprehensive data landscape, repeat these steps for additional sources like Salesforce or Azure Blob Storage. Each new source enriches the decision-making canvas.
Step 6: Combine and Analyze Data
- Create Reports: With the data integrated, the focus shifts to creating reports. For an executive, this means using Power BI’s data modeling features to draw connections between different data sets, ultimately crafting a narrative that informs strategic decisions.
Additional Resource:
- For a comprehensive guide on connecting to data in Power BI, visit Microsoft’s Power BI documentation.
Power BI Data Integration Case Studies
1- Walmart: Transforming Retail Finance with Power BI
- Background: As the world’s leading retailer, Walmart manages approximately 10,500 stores, clubs, and 2.3 million associates globally, generating trillions of transactions.
- Challenge: The sheer volume of data created challenges in centralization, preparation, and consumption.
- Solution: Walmart’s finance organization standardized Microsoft Power BI, developing a “semantic model library” to handle vast financial data.
- Outcome: This solution provided easy access to comprehensive data for all levels, from executive leadership to individual analysts, enabling swift and powerful data analysis.
Continue reading: Walmart Finance standardizes on Power BI for reporting and analytics.
Quote from Micah Dail, Director, Finance Data & Analytics:
“With Microsoft Power BI, we’ve established a semantic model library covering massive amounts of financial data. It gives associates easy access to the full breadth and depth of Walmart data…and enables them to powerfully analyze the data in a very quick manner.”
2- Netronix Integration: Achieving Project Management Success with AlphaBOLD
- Background: Netronix Integration, Inc., a growing business, needed a consolidated approach to manage projects within its ERP solution.
- Challenge: The company struggled with limited visibility into KPIs and lacked efficient data-driven reporting capabilities.
- Solution: By implementing BOLDSuite Analytics, AlphaBOLD’s custom Power BI fused data platform, Netronix Integration managed to enhance its project management.
- Outcome: The adoption of this integrated data platform enabled Netronix to gain consolidated project management capabilities and improved visibility into key performance indicators, which is essential for staying competitive in the market.
These case studies illustrate the transformative power of Power BI data integration and analytics leading to significant improvements in business operations and decision-making.
Advanced Power BI Data Integration Techniques
Understanding advanced Power BI data integration techniques is crucial for C-level executives for data-driven decision-making. These techniques are not just technical processes; they are strategic tools that can significantly enhance business intelligence capabilities. Let’s delve into these techniques with a focus on their strategic implications:
1. Custom Data Connectors:
Custom Power BI data connectors allow executives to tap into unique, non-standard data sources, providing a competitive edge by leveraging proprietary data in decision-making. By using connectors developed with Power Query M language, businesses can extract specific insights that align with their unique strategic goal.
2. Dataflows for Complex ETL Processes:
Dataflows streamline the ETL process, ensuring that the data feeding into Power BI models is clean and organized, a vital factor for reliable executive reporting. This technique aids in preparing data more efficiently, crucial for time-sensitive decision-making at the executive level.
3. Real-Time Data Streaming:
Real-time data streaming is essential for dashboards that inform immediate strategic decisions, such as monitoring live operational metrics. It enables executives to respond quickly to real-time business events, a capability critical in today’s fast-paced business environment.
You may also like: Overcoming Power BI Integration Challenges in 2025
4. Integration with Azure Services:
Integrating with Azure services like SQL Data Warehouse expands Power BI’s capabilities, enabling large-scale, cloud-based analytics suitable for enterprise-level strategic needs. This offers executives a robust platform for handling vast amounts of data, which is essential for comprehensive business intelligence.
5. Advanced DAX Calculations:
Advanced DAX techniques enable deeper data analysis, allowing executives to derive nuanced insights critical for strategic planning and performance measurement. Tailored calculations and measures provide a customized view of data, supporting specific strategic objectives.
6. Using Python and R Scripts:
Incorporating Python and R for advanced analytics offers executives tools for predictive decision-making, risk assessment, and uncovering hidden trends. This brings the power of data science into Power BI, enabling sophisticated analyses like machine learning models directly within business reports.
Need Help with Power BI? Get a Free Demo!
Dive deeper into your data with AlphaBOLD's expert Power BI data integration services. We help you navigate the complexities of data analytics, providing custom solutions that optimize your data strategy and drive business growth.
Request a DemoHow AlphaBOLD Can Help You Integrate Multiple Data Sources in Power BI
At AlphaBOLD, we specialize in Power BI data integration solutions that empower businesses to experience the full potential of Power BI. Our team of experts will guide you through every step of the integration process, ensuring that you can connect your diverse data sources efficiently and effectively. Whether it’s on-premise data, cloud services, or third-party APIs, we can help you:
- Simplify Complex Data Connections: We help businesses connect their data from multiple sources into Power BI without complications.
- Optimize Data Transformation: Our team ensures that your data is clean, accurate, and ready for insightful analysis, saving you time and resources.
- Create Custom Dashboards & Reports: We customize Power BI solutions that cater to your specific business needs, delivering actionable insights in real-time.
- Ongoing Support & Maintenance: We provide continuous support to keep your Power BI solution running smoothly and ensure it evolves with your business.
Interested in learning more? Contact us today to discuss how AlphaBOLD can help optimize your Power BI integrations.
Conclusion
As we look towards the future, Power BI’s role in shaping the landscape of data analytics is poised to grow even more significant. With its evolving capabilities in integrating diverse data sources and advanced analytical features, Power BI stands as a cornerstone tool for businesses seeking to harness the full potential of their data. It’s not just about what Power BI can do today but how it will continue to evolve, adapting to new technologies and business needs.
Solution providers like AlphaBOLD play a crucial role. With offerings like BOLDSuite Analytics, a Power BI data connector, AlphaBOLD exemplifies the innovation and specialization that drive the future of data analytics forward. These tools and services are not just add-ons; they are integral parts of a holistic approach to Power BI data integration, unlocking new possibilities and efficiencies for businesses around the globe. As Power BI grows, so does its ecosystem, with companies like AlphaBOLD at the forefront of this evolution.
Explore Recent Blog Posts