
Table of Contents
Introduction
Executives and department heads rely on Power BI development to turn complex datasets into clear, actionable insights. But to truly scale impact—across finance, operations, sales, and beyond—your teams need dashboards that load faster, reveal trends sooner, and minimize dependence on IT. This blog explores advanced Power BI tips that translate into better business decisions.
As we move into 2026, Power BI has evolved from a self-service visualization tool into Microsoft’s flagship AI-powered analytics platform within Microsoft Fabric. The convergence of Copilot AI, enterprise-grade governance features, and critical upcoming deprecations presents both unprecedented opportunities and migration requirements for C-suite executives. This updated guide includes the latest 2025-2026 feature releases, deprecation timelines, and strategic recommendations.
You may also like: Power BI 2026 Updates: Key Changes from October 2025 Release Wave 2
What's New in Power BI for 2026
The 2025-2026 release cycle marks the most significant transformation in Power BI’s decade-long history. Microsoft has repositioned the platform from self-service BI to an enterprise-grade, AI-first decision intelligence system. Here are the key updates executives need to know:
| NEW FEATURE | EXECUTIVE IMPACT |
|---|---|
|
Copilot for DAX (GA) |
AI generates complex calculations from natural language, reducing analyst dependency by 40%+ |
|
Standalone Copilot Mobile |
Executives can query data on-the-go without opening reports—get answers in seconds |
|
Microsoft Fabric Integration |
Unified data platform eliminates silos; Direct Lake mode delivers 10x faster queries |
|
PBIR Format Default (Jan 2026) |
New report format enables better version control and team collaboration |
|
MCP Server (Preview) |
AI agents can now access Power BI semantic models for automated workflows |
|
Verified Answers |
Governance-approved AI responses ensure compliance and accuracy |
You may also like: AI-Powered Insights in Power BI for Better Business Decisions
Critical Deprecations & Migration Requirements
Ignoring these deprecations could leave your organization with broken reports and compliance gaps. Plan your migrations now:
| NEW FEATURE | DEADLINE | IMPACT | ACTION REQUIRED |
|---|---|---|---|
|
R/Python Visuals (Embed) |
May 1, 2026 |
Charts display blank |
Migrate to Fabric Notebooks |
|
Q&A Feature (Legacy) |
December 2026 |
Legacy NLP removed |
Transition to Copilot |
|
32-bit Desktop |
August 2025 |
No more updates |
Switch to 64-bit build |
|
Bing Maps Visual |
Mid-2026 |
Maps stop rendering |
Migrate to Azure Maps |
|
Premium P-SKUs |
Jan 2025 (Retired) |
Cannot purchase new |
Move to Fabric SKUs |
Automating Insight Delivery: A Power BI Development Advantage
Natural Language Analysis (Q&A Visual):
Through the Q&A Visual natural language analysis function, Power BI enables users to access their data by processing queries through natural language. You can interact with the system directly through questions, and then the system interprets your statements based on its semantic model. The visual presents vital elements while suggesting ways to enhance the search parameters. Q&A settings allow you to enhance results while setting synonyms, viewing frequently asked questions, and training the system through question suggestions. The Q&A feature lets users type natural-language questions (e.g., “What were sales last quarter by region?”) and instantly receive visual answers. This self-service capability reduces dependence on analysts and helps business users make decisions faster.
Important Update: Microsoft has announced the deprecation of the legacy Q&A feature in December 2026. Organizations should begin transitioning to Copilot, which provides more advanced natural language capabilities with filtered report summaries, context-aware responses, and integration with Microsoft Fabric.

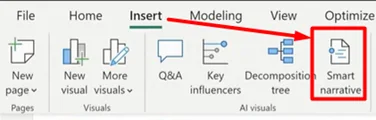
Smart Narrative:
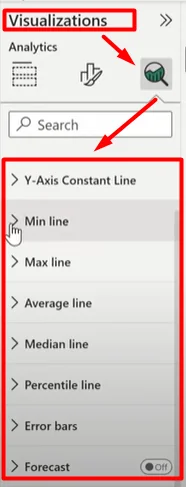
Further Analysis Tools:
Copilot-Powered Analysis
Copilot now enhances automated insight delivery with several new capabilities:
- Filtered Report Summaries: Copilot intelligently applies filters to answer specific questions like “What were sales in Q3?” without manual slicer adjustments
- Auto-Generated Measure Descriptions: AI creates documentation for your DAX measures automatically, improving team collaboration
- SharePoint Embedding: Copilot now works in embedded Power BI reports within SharePoint Online
- Mobile Standalone Experience: Executives can query data on-the-go without opening full reports
Writing Better DAX: Principles and Practices
You’ve likely heard about DAX. It is the formula language that powers Power BI’s calculations. And while you don’t need to write DAX yourself, understanding its role is essential. It determines how your metrics are calculated, how fast your reports load, and whether your teams trust the numbers on the screen. When it’s poorly implemented, it can lead to slow dashboards, inconsistent KPIs, and unreliable insights across departments.
A strong Power BI development partner will:
- Use measures over calculated columns to improve performance.
- Build consistent logic using variables so every team works off the same metrics.
- Implement time intelligence functions to help leadership make informed decisions month-over-month and year-over-year.
- Leverage tools like DAX Studio to validate accuracy and optimize performance behind the scenes.
- Leverage Copilot for DAX (now GA) to generate complex calculations from natural language prompts, with human review for validation.
- Use RANK instead of RANKX for better performance in large datasets (per SQLBI 2025 guidance).
When you choose an implementation/customization partner, you trust them to ensure every chart, metric, and dashboard tells the truth quickly and reliably. Having a good knowledge of DAX is a pro tip!
Performance Tuning and Optimization

- Start with a clean data model: Using fact and dimension tables, a star schema keeps relationships simple and improves overall query speed.
- Remove what you don’t use: Eliminate unnecessary columns or tables. Even unused data takes up memory and processing time.
- Choose the right data types: Using appropriate data types (e.g., whole numbers instead of text) reduces refresh delays and accelerates report loading.
- Use Power Query for heavy logic: Offload complex transformations to Power Query instead of DAX to speed things up behind the scenes.
- Watch out for high-cardinality columns: Columns with too many unique values (like transaction IDs or timestamps) slow down performance, especially when used in visuals or slicers.
- Use Direct Lake Mode (Fabric): For Microsoft Fabric environments, Direct Lake mode queries data directly without imports—delivering up to 10x faster performance than traditional import models.
- Leverage Visual Calculations: New feature allows row-level calculations without complex DAX measures, simplifying report development.
- Monitor with Performance Analyzer: New web report performance tools identify bottlenecks and provide actionable optimization recommendations.
Once Power BI is implemented, these tuning habits help internal teams build and scale reports. A well-optimized environment is easier to manage as it makes every insight easier to access.
Data Profiling and Quality Checks

One of the most valuable Power BI tips—often overlooked—is learning how to validate your data before it reaches a report. Even well-designed dashboards can mislead if they’re built on inconsistent, incomplete, or duplicated data.
Power BI includes user-friendly features that make it easier for business users to assess data quality without relying on IT:
- Transform Data (Power Query Editor): This is the starting point for all data preparation. You can clean and shape raw data before it’s visualized. It is found in the Home tab.
- Column Quality, Distribution, and Profile: These built-in tools help you identify errors, nulls, or unusual values at a glance, ideal for spotting red flags before they influence decisions.
- Hover-over Insights: Simply hovering over a column header shows the percentage of valid, error, and empty fields, making early diagnosis effortless.
- Quick Fixes via Context Menu: You can remove duplicates, replace blanks, or modify column formats directly within the interface, no coding needed.
This helps build trust in your reports. After your solution is up and running, mastering these quality checks ensures your team works with clean, dependable data from day one.
You may also like: How Power BI Helps You Monitor and Fix Data Quality Issues
Microsoft Fabric Strategy for Executives
Microsoft Fabric represents a fundamental shift in how enterprises manage data. As an executive, understanding this platform is no longer optional—it’s a strategic imperative. Power BI is now a core component of Fabric, not a standalone tool.
Key Benefits for the C-Suite:
- OneLake: Single data repository eliminates data silos and reduces storage costs by up to 60%
- Direct Lake Mode: Query data directly without imports—10x faster than traditional import models
- Unified Governance: Single security model across all data assets simplifies compliance (SOC 2, GDPR, HIPAA)
- Dataflows Gen2: Next-gen ETL connects Power BI directly to enterprise lakehouses
- Deployment Pipelines: Now support semantic models with Direct Lake on OneLake tables for proper dev/test/prod workflows
Drive ROI with Custom Power BI Development
Whether starting from scratch or optimizing an existing setup, AlphaBOLD ensures your Power BI development process delivers value and scalability.
Request a DemoNew Visual Enhancements (2025-2026)
- New Card Visual (GA): Modern, responsive KPI cards with enhanced formatting options
- Auto-Expanding Matrix Columns: Tables automatically resize for optimal readability
- Enhanced Image Visuals: Center-circle content, mouseover info, and measure-based conditional formatting
- Individual Line Segment Coloring: Highlight specific data points in line charts for emphasis
- Azure Maps (Replacing Bing Maps): Enhanced base map customization with modern mapping capabilities
Seamless Integration
In Gartner’s 2024 Magic Quadrant for Analytics and Business Intelligence Platforms, Microsoft was named a Leader for the seventeenth consecutive year, highlighting its ongoing innovation and reliability for enterprise use. In 2025, Microsoft was also named a Leader and Outperformer in the GigaOm Radar for Semantic Layers & Metric Stores, reinforcing Power BI’s position as the enterprise standard for trusted analytics. This sustained focus on innovation reinforces why many organizations rely on Power BI development to integrate insights into daily workflows.
- Teams Integration: Reports published to the service can be embedded directly into Teams channels, ensuring alignment during daily discussions and decision-making sessions.
- PowerPoint Embedding: Adding live visuals to presentations allows executives to drill down into data mid-meeting, which is ideal for strategy updates and stakeholder reviews.
- QR Code Sharing: For field teams or mobile access, scannable codes provide quick, seamless access to key reports without sending links.
- Power BI Controller for PowerPoint: New preview feature simplifies slide-level control of embedded Power BI content in presentations.
- Copilot in SharePoint Embedded Reports: Users can now engage with Copilot directly within embedded report experiences in SharePoint Online.
You may also like: Integrating Power BI: A Guide to Merging with Your Current Infrastructure
Streamlining Workflows with Templates and Version Control
As reporting needs grow, so does the importance of consistency and collaboration. This is where thoughtful Power BI helps teams scale without losing control over versioning, formatting, or metric definitions.
Here are a few practical tips that help ensure your reports remain structured and repeatable:
- Use report templates (.pbit): Templates allow teams to reuse layouts, calculated measures, themes, and data models—saving time while ensuring a consistent reporting experience across departments.
- Adopt naming conventions and changelogs: Maintaining a clear version history and consistent file naming makes it easier to collaborate and troubleshoot, especially when multiple analysts or contributors are involved.
- Leverage version control tools: Tools like Git (or even SharePoint with versioning enabled) help track edits, manage iterations, and roll back changes when needed.
- PBIR Format (January 2026 Default): Starting January 2026, all new reports will use the PBIR format by default, enabling better version control and team collaboration. Existing reports will auto-convert when edited.
- Semantic Model Scripting (TMDL): Named expressions and parameters can now be scripted to TMDL view, modified, and applied back—improving DevOps workflows.
These tips are especially valuable for organizations that build reports across multiple teams or regions. A structured development process means faster delivery, better governance, and fewer errors as new reports are deployed.
Power BI Licensing & Pricing Updates for 2025-2026
Microsoft implemented significant Power BI pricing changes effective April 1, 2025. Understanding these changes is critical for budget planning:
- Power BI Pro & PPU Price Increases: Both license types have increased in cost. Audit your license usage and consider Fabric capacity options.
- Premium P-SKU Retirement: Power BI Premium per capacity SKU (P-SKUs) cannot be purchased after January 1, 2025. Existing customers must transition to Microsoft Fabric SKUs.
- Microsoft 365 E5 Exception: Customers accessing Power BI through M365 E5 or Office 365 E5 annual subscriptions will not experience pricing changes.
- Org Apps for Pro Users: Org apps (preview) are now available in Pro license mode, allowing multiple customized app experiences per workspace.
You may also like: The Value of Consulting Expertise in Power BI Implementations
Transform Power BI into a Strategic Business Asset
Want dashboards that actually answer your business questions? Our Power BI development experts build scalable solutions that help teams move faster and decide smarter, without relying on IT.
Request a DemoFinal Thoughts
Power BI development directly impacts how fast and confidently your teams can make decisions. Clean models, optimized reports, and consistent metrics aren’t just technical wins; they reduce delays, misalignment, and rework.
The tips shared above are practical ways for business teams to maintain performance, accuracy, and usability, even after implementation. With the right structure in place, your teams don’t need to rely on IT for every report—they can build and adapt with clarity. If your dashboards aren’t answering business questions fast enough, it’s time to fix that. Request a demo with AlphaBOLD today.
The Power BI 2026 updates represent more than routine product enhancements—they mark a strategic shift toward AI-driven analytics, unified data architecture, and intelligent visualization. Acting now on deprecation timelines and Fabric migration ensures your organization enters 2026 ready for innovation rather than reacting to broken reports.
FAQs
The three most critical changes are: (1) The deprecation of R and Python visuals in embedded scenarios by May 2026, which will cause affected charts to display blank; (2) The transition from legacy Q&A to Copilot by December 2026; and (3) The migration from Bing Maps to Azure Maps by mid-2026. Additionally, the PBIR format becomes the default for all new reports starting January 2026. Organizations should audit their existing reports now and plan migrations accordingly.
Microsoft Fabric represents a fundamental shift from standalone Power BI to a unified analytics platform. Power BI is now a core component of Fabric, not a separate tool. Key benefits include OneLake (single data repository reducing silos), Direct Lake mode (10x faster queries without data imports), unified governance across all data assets, and Dataflows Gen2 for enterprise-scale ETL. Organizations using Power BI Premium P-SKUs must transition to Fabric SKUs, as P-SKUs can no longer be purchased after January 2025.
Copilot for Power BI is Microsoft’s AI assistant that transforms how users interact with data. Key capabilities include: generating DAX calculations from natural language prompts, creating filtered report summaries without manual slicer adjustments, auto-generating measure descriptions for better documentation, and enabling mobile executives to query data on-the-go without opening full reports. Copilot is now generally available and works in SharePoint embedded reports. It replaces the legacy Q&A feature, which will be deprecated in December 2026.
Microsoft increased pricing for Power BI Pro and Premium Per User (PPU) licenses effective April 1, 2025. Organizations should audit current license usage and consider Fabric capacity options for cost optimization. Note that customers accessing Power BI through Microsoft 365 E5 or Office 365 E5 annual subscriptions are not affected by these price increases. Additionally, Power BI Premium per capacity (P-SKUs) can no longer be purchased—existing customers must transition to Fabric SKUs at agreement end.
With Copilot becoming central to Power BI analytics, executives should establish clear governance frameworks: (1) Define Verified Answers—governance-approved responses for critical business metrics; (2) Implement mandatory review workflows for Copilot-generated DAX calculations; (3) Train analysts on when AI suggestions need human verification; (4) Use admin settings to enable/disable Copilot at workspace or report level; (5) Consider restricting Copilot from answering questions from report visuals in scenarios with sensitive data (financial reports, HR dashboards, compliance analytics).
As a Microsoft Gold Partner, AlphaBOLD provides end-to-end Power BI consulting services including: implementation and dashboard design, data modeling and DAX optimization, Microsoft Fabric migration planning, Copilot governance framework development, licensing guidance and cost optimization, and ongoing support and training. Our experts help enterprises modernize data environments, integrate Fabric-ready architectures, and build governed AI adoption plans that align with Microsoft’s evolving ecosystem. Request a consultation to discuss your specific needs.
According to Forrester Consulting research, organizations implementing Power BI have documented: 127% ROI within 3 years, 125 hours saved annually per BI user through self-service capabilities, time-to-market reduction from 18 months to 10 months for new products/services, 42% reduction in centralized analytics team workload, 6% faster solution quotation rates, and 5% boost in operational income. These results demonstrate Power BI’s value as a strategic business asset, not just a reporting tool.