Power BI Insights for Energy Efficiency: Client Success Story

Table of Contents
Introduction
When companies deal with high volumes of energy usage data, the challenge is rarely about collecting it. The real difficulty lies in transforming that data into timely, cost-effective insights that guide better decisions. I recently worked with a client facing this very issue, and the solution centered on using Power BI insights for energy efficiency.
In this blog, I will walk through the challenges our client faced with their legacy BI system, the approach we took to redesign their data management using Azure Analysis Services and Power BI and the results that enabled them to scale, reduce costs, and improve sustainability outcomes.
What Challenges Did the Client Face Before Using Power BI Insights for Energy Efficiency?
The client’s main challenges were cost, latency, and complexity in handling energy usage data. Their existing BI system slowed decision-making and created financial strain, making it difficult to scale operations and track efficiency goals in real time.
From my perspective as a consultant, the issues fell into three areas:
- High Costs: Good Data’s licensing model became unsustainable as data volumes increased.
- Latency Problems: Reports were delayed, making it impossible to act on time-sensitive trends.
- Complex Queries: Users struggled to extract insights quickly, limiting the value of their BI platform.
These challenges didn’t just affect IT operations, they directly impacted business outcomes like forecasting, budgeting, and sustainability reporting. It was clear they needed a scalable approach to energy data management that could deliver actionable insights consistently.
How Did We Solve the Client’s Energy Data Challenges with Power BI Insights for Energy Efficiency?
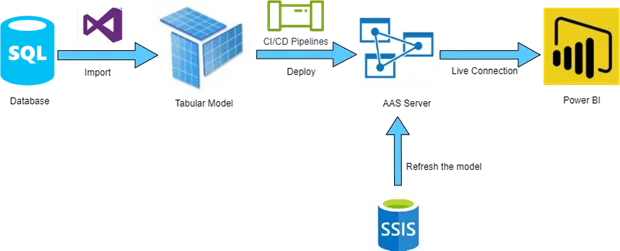
We replaced their costly, slow BI system with a scalable architecture built on Azure Analysis Services, automated refresh pipelines, and Power BI reporting. This improved performance, reduced costs, and delivered real-time actionable insights.
As a consultant on this project, my role was to redesign the client’s data environment step by step:
- Assessment: Reviewed infrastructure and identified bottlenecks in reporting and query performance.
- Data Models: Built Azure Analysis Services tabular models to organize and scale large energy datasets.
- Automation: Deployed SSIS packages to refresh data without manual intervention.
- Continuous Delivery: Set up CI/CD pipelines with Azure DevOps for smooth deployments and updates.
- Reporting: Designed Power BI dashboards with KPIs and filters for intuitive analysis.
Ready to Improve Your Reporting with Power BI?
Many organizations face the same challenges this client did: slow reporting, high BI costs, and limited visibility. AlphaBOLD’s consultants specialize in designing scalable Power BI solutions that deliver actionable insights for efficiency and growth.
Request a ConsultationWhat Results Did the Client Achieve with Power BI Insights for Energy Efficiency?
The client eliminated reporting delays, reduced BI costs, and gained real-time visibility into energy usage. With Power BI dashboards, they could track efficiency across regions and make faster, data-driven decisions that supported sustainability goals.
From my perspective, the difference was immediate:
- Latency Removed: Reports that once took hours were available within minutes.
- Scalability Secured: The system handled growing data volumes without performance loss.
- Better Decisions: Stakeholders drilled into usage trends by region, city, and time of day.
- Sustainability Gains: Clear visibility into patterns helped optimize energy consumption.
For the client, these improvements were more than technical upgrades. They changed how leadership viewed and acted on data, turning energy usage reports into strategic tools for operational efficiency and sustainability planning.
Further Reading: Power BI Development: Tips & Tricks for Executives
Why Do Power BI Insights for Energy Efficiency Matter Beyond This Client?
The challenges this client faced are not unique. Many organizations struggle with BI platforms that become too expensive or too slow as data volumes increase. Research by McKinsey highlights that companies embracing scalable, data-driven practices are seeing significant gains in both efficiency and decision-making. In my consulting work, I’ve seen similar issues across industries:
- Manufacturing: IoT sensors generate massive production data that requires real-time analysis.
- Finance: Latency in BI reporting impacts forecasting accuracy.
- Utilities: Rising demand for sustainability reporting makes efficiency metrics essential.
What made this project stand out is how quickly the benefits became visible once the right architecture was in place. It reinforced that scalable BI is not just about better dashboards, but about enabling smarter decisions where efficiency and sustainability matter.
Further Reading: Leveraging the Benefits of Power BI for Retail Businesses
FAQs
Legacy systems often create hidden costs, from high licensing fees to reporting delays that slow decision-making. At AlphaBOLD, we’ve seen many clients reach a tipping point where these risks outweigh the value, prompting a shift to scalable BI solutions.
Explore AlphaBOLD’s Power BI Services
Whether your business needs real-time dashboards, scalable data models, or automation support, AlphaBOLD can help you turn complex datasets into clear decisions. Our consultants bring both technical expertise and industry awareness to every project.
Request a ConsultationConclusion
This project showed how the right mix of cloud architecture and analytics can turn energy usage data into a source of efficiency and cost savings. Combining Azure Analysis Services with Power BI insights for energy efficiency, the client gained real-time visibility, reduced costs, and built a scalable foundation for future growth.
At AlphaBOLD, our focus is on helping organizations move from data challenges to measurable business outcomes. Suppose your team is facing similar struggles with latency, rising BI costs, or sustainability reporting. In that case, our consultants can help you design a system that delivers clarity and confidence in decision-making.
Explore Recent Blog Posts