
Power BI vs Tableau- Which Data Visualization Tool is Right?

Caroline Mayou
Table of Contents
Introduction
Power BI is the stronger choice for organizations already running on Microsoft 365 or Azure, especially now that it’s the native reporting layer in Microsoft Fabric. It costs less (from $14/user/month) and requires less custom integration work.
Tableau is the stronger choice for teams that prioritize best-in-class, out-of-the-box visualization design and are prepared to pay a premium (from $15/user/month for Standard to $35/user/month for Enterprise).
This guide breaks down Power BI vs Tableau across Fabric integration, pricing, AI capabilities, connectors, and performance so you can make a defensible decision for 2026.
What's Changed Between Power BI and Tableau in 2026?
Both platforms have shifted from “visualization tools” to AI-embedded analytics platforms. The differentiator is no longer whether a tool has AI; it’s which workflow the AI supports.
Power BI in 2026:
- Copilot for Power BI is generally available across desktop, web, and mobile, with a standalone Home screen entry point. It generates DAX, builds report pages from natural language, and can be grounded to specific reports or semantic models.
- PBIR (Power BI Enhanced Report Format) became the default for new reports in January 2026, enabling Git-based version control and CI/CD. General availability is planned for Q3 2026, after which older formats will be phased out.
- Azure Maps has replaced Bing Maps for geographic visuals.
- Semantic models can now be edited directly in the Service, no round-trip to Desktop required.
Tableau in 2026:
Tableau Agent (formerly Einstein Copilot) is built into Desktop and Prep, handling natural-language calculations and visualization suggestions via a Semantic Learning layer.
Tableau Pulse now includes LLM-guided Q&A, Pace-to-Goal tracking, correlated metrics analysis, and an “Analyze with AI” entry point.
Custom Themes enable global branding across workbooks.
Marketo and Oracle Eloqua connectors were deprecated in version 2026.1; JDBC-based replacements are available via Tableau Exchange.
Key Implication:
Power BI’s Copilot is built for faster report creation and governance. Tableau’s Agent and Pulse are built for autonomous monitoring and conversational exploration. Choose based on the workflow you need, not on AI availability alone; both now have it.
An Overview of What is Power BI?
Power BI is Microsoft’s business analytics platform, built to integrate natively with Excel, Azure, SharePoint, Teams, and Microsoft Fabric.
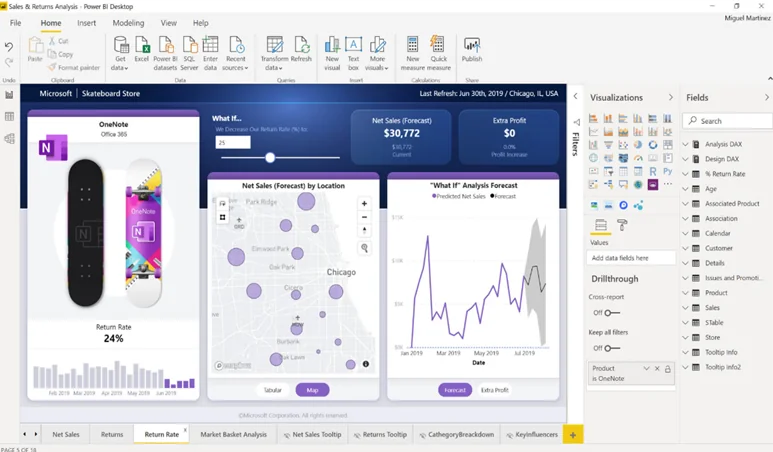
Power BI Pricing:
- Power BI Desktop: free
- Power BI Pro: $14/user/month (increased from $10 in April 2025)
- Premium Per User: $24/user/month
- Premium Capacity: from $4,995/month (P1 SKU), transitioning to Fabric F-SKUs
- Included at no extra per-user cost for organizations on Microsoft 365 E5 or Office 365 E5
Read more about:Power BI Pricing Guide: Plans, Costs & Licensing 2026
Key Capabilities:
- Built-in and marketplace custom visuals
- Power Query for data transformation and modeling
- Native collaboration inside Teams and SharePoint
- Real-time streaming dashboards
- PBIR format for Git-based version control and CI/CD
- Direct Lake and OneLake integration via Fabric
Power BI Integration with Microsoft Fabric:
Power BI is no longer a standalone BI tool; it’s the reporting layer inside Microsoft Fabric, Microsoft’s unified SaaS platform for data engineering, data science, real-time analytics, and BI. This is the single biggest shift in the Power BI ecosystem since 2023, and any 2026 evaluation needs to account for it.
Practically, Fabric integration means:
- OneLake is a single data layer. Power BI reports can query data directly from OneLake without duplicating it into a separate semantic model, reducing ETL overhead.
- Direct Lake mode. Reports can read Delta tables in OneLake at near-import speeds without a full data refresh, which changes the performance calculus for large datasets.
- Unified administration. Fabric capacity (F-SKUs) is replacing standalone Premium capacity (P-SKUs) as Microsoft’s primary packaging. Microsoft has stated that this transition will continue through 2026, so organizations on Premium Capacity should plan a migration path.
- Data engineering and BI in one platform. Dataflows Gen2, lakehouses, and real-time intelligence sit alongside Power BI reports, so data and BI teams work from the same governed source rather than separate systems.
If your organization is already investing in Fabric for data engineering or lakehouse architecture, Power BI is the natural reporting layer, since it lets you avoid building and maintaining a parallel BI stack. If you’re not on Fabric and have no plans to adopt it, this advantage narrows considerably.
Read more about: Select Overcoming Power BI Integration Challenges in 2025
Ready to see How Power BI Can Transform your Data into Actionable Insights?
Request a personalized demo today and discover how seamless integration with Microsoft 365, cost-effective solutions, and powerful data modeling can benefit your organization.
Request a DemoAn Overview of What is Tableau?
Tableau is Salesforce’s data visualization platform, built around a “grammar of graphics” approach that prioritizes visual flexibility and design quality over ecosystem integration.
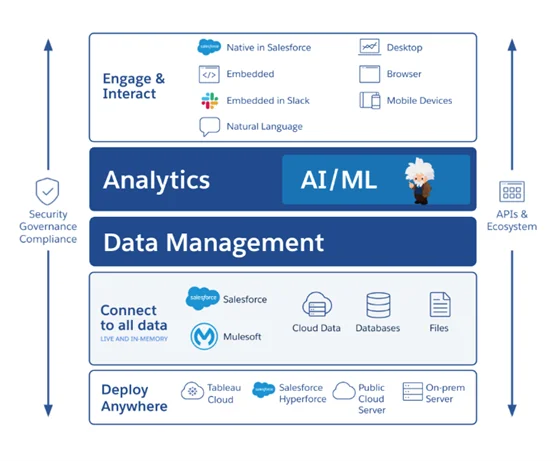
Tableau Pricing:
- Tableau Public: free
- Tableau Cloud Standard — Viewer: $15/user/month, Explorer: $42/user/month, Creator: $75/user/month
- Tableau Enterprise edition — Viewer: $35/user/month, Explorer: $70/user/month, Creator: $115/user/month
- Tableau+ Bundle (Tableau Agent, premium Pulse, enhanced support): contact sales
Key Capabilities:
- Advanced out-of-the-box visualizations (heat maps, treemaps, complex charts) with no coding required
- Grammar-of-graphics design model for building custom visuals from structured elements
- Strong in-memory performance on large, complex datasets
- Tableau Pulse for AI-driven metric monitoring and alerts
- Tableau Agent for conversational calculation-building
How Do Power BI and Tableau Pricing Compare?
| Tier / Expense | Power BI | Tableau Cloud Standard |
|---|---|---|
|
Free Tier |
Power BI Desktop |
Tableau Public |
|
Entry License |
Pro: $14/user/month |
Viewer: $15/user/month |
|
Mid License |
PPU: $24/user/month |
Explorer: $42/user/month |
|
Full License |
Included in M365 E5 / standalone Pro |
Creator: $75/user/month |
|
Capacity / Premium |
$4,995/month (P1); migrating to Fabric F-SKUs |
Enterprise edition: $115 Creator, $70 Explorer, $35 Viewer |
|
AI Premium Add-On |
Copilot included in Pro+ plans |
Tableau+ Bundle (contact sales) |
Key Insight: For most mid-sized deployments, Power BI is meaningfully cheaper, particularly for organizations already licensed for Microsoft 365 E5, where Pro is included at no additional cost. Tableau’s per-role model provides more granular control over who gets creator-level access, but the total cost of ownership climbs quickly once Creator seats and Tableau+ features are added to the mix.
Which Tool Offers Better Data Connectors?
Both platforms connect to a broad range of data sources, but the type of connectivity that matters has shifted with each platform’s 2026 architecture.
Power BI Connectors:
- Native connectors for Excel, SQL Server, Azure Synapse, Dataverse, SharePoint, and hundreds of marketplace sources
- Direct Lake connectivity to OneLake/Fabric lakehouses, this is now the fastest path for large-scale data without a traditional import refresh.
- On-premises Data Gateway for hybrid environments
- Dataflows Gen2 for reusable, low-code ETL pipelines that feed both Power BI and other Fabric workloads
Tableau Connectors:
- Native connectors for major databases, cloud warehouses, and Salesforce data
- Tableau Exchange marketplace for JDBC-based and third-party connectors, which now includes replacements for the Marketo and Oracle Eloqua connectors deprecated in version 2026.1
- Tableau Prep for connector-level data cleaning before it reaches a workbook
Practical Implication: If your data already lives in OneLake, Azure, or Dataverse, Power BI’s connectors require less configuration. If you’re pulling from Salesforce or a wide mix of specialized SaaS tools, check the Tableau Exchange first; some legacy connectors have been deprecated and now require a JDBC-based replacement.
How Do Power BI and Tableau Compare on Visualization Quality?
Tableau generally produces higher-quality visuals out of the box; Power BI closes most of that gap with add-ons and AI assistance, at a lower cost.
Power BI:
- Strong standard visual library, extendable with Deneb (a Vega/Vega-Lite-based custom visual) for advanced, code-driven charts
- Can struggle with very high-density visuals, millions of points on a single scatterplot, for example
- Copilot now suggests visualization types automatically based on data structure, reducing design time
Tableau:
- Comprehensive advanced visualization library available without add-ons or code
- The Grammar-of-graphics model makes complex visuals more consistent to build
- Handles very large datasets and dense visuals with less performance degradation
Not Sure Whether Power BI or Tableau Fits Your Needs?
Get expert recommendations based on your data sources, users, and reporting goals.
Talk to an ExpertHow Do Power BI and Tableau Compare on Performance?
Tableau tends to handle raw visual and calculation performance better at scale; Power BI has closed ground with Fabric-native features.
Power BI:
PBIR reduces report file overhead and improves Git-based collaboration. Semantic model editing in the Service cuts round-trips to the Desktop. Direct Lake mode (via Fabric) significantly improves performance on very large datasets by querying OneLake directly instead of importing.
Tableau:
Table calculations run efficiently at the mark level, even with complex logic. Parameter and set actions support highly responsive, real-time interactivity. Pulse’s Enhanced Q&A surfaces correlated metrics without requiring a manual drill-down.
Which Tool Has an Easier Learning Curve?
Power BI is easier for beginners and Microsoft-native teams; Tableau has a steeper learning curve but rewards users with greater visualization control.
Power BI:
Drag-and-drop interface, Microsoft 365-familiar UI, and Copilot-generated DAX and layouts mean business users can build functional dashboards without deep technical training.
Tableau:
Basic visualizations are approachable, but advanced customization requires real platform depth. Tableau Agent lowers this bar for calculations and chart suggestions, but complex dashboard design still benefits from specialized skills. Tableau’s community, forums, conferences, and third-party training are extensive.
Which Tool Fits Your Industry Better?
Power BI for Retail:
Real-time sales monitoring against historical benchmarks, inventory-level tracking to avoid stockouts or overstock, and customer behavior analysis for merchandising decisions.
Tableau for Healthcare:
Centralized patient data views for faster clinical decisions, treatment-outcome visualization for protocol evaluation, and operational dashboards for bed management and staff scheduling.
Both tools support other verticals well; these are simply where each has the strongest documented traction.
Choose the Right BI Platform for Your Business
Compare your reporting, licensing, and analytics requirements with guidance from our BI specialists.
Request a DemoConclusion
Power BI and Tableau are both mature, AI-embedded analytics platforms. In 2026, the decision comes down to ecosystem fit rather than raw feature availability. Power BI wins on cost, Microsoft 365 integration, and Fabric-native data architecture. Tableau wins on out-of-the-box visualization quality and large-dataset performance.
Before deciding, evaluate:
- Where your data currently lives (Microsoft ecosystem vs. mixed/best-of-breed)
- Whether you’re adopting or planning to adopt Microsoft Fabric
- Your total cost of ownership across licensing, implementation, and AI add-ons
- Whether your priority is fast report creation (Power BI) or proactive, autonomous insight discovery (Tableau)
FAQs
For many SMBs, yes. Choose Power BI if you want a lower total cost of ownership and already use Microsoft 365, since it fits naturally within Microsoft’s ecosystem.
Yes, but it depends on your requirements. Choose Power BI if your organization is focused on Microsoft technologies; if you rely on Tableau’s advanced visualization capabilities, assess feature parity before switching.
Power BI is the native reporting and visualization layer for Microsoft Fabric. Choose it for Fabric environments because it supports OneLake, Direct Lake, and Fabric workloads without additional integration.
Tableau often performs better with complex visualizations and large datasets. Choose Tableau if that performance matters most; otherwise, note that Power BI has improved through Direct Lake, semantic model enhancements, and Microsoft Fabric integration.
Both platforms include AI-powered features. Power BI Copilot focuses on report creation, DAX generation, and dashboard development, while Tableau Agent and Tableau Pulse emphasize conversational analytics, automated insights, and metric monitoring, so choose based on your AI priorities.
Consider migrating from Tableau to Power BI if your organization has standardized on Microsoft 365, Azure, or Microsoft Fabric, or if reducing licensing costs is a priority. Before switching, evaluate your existing dashboards, data sources, and reporting requirements.