
Table of Contents
Introduction
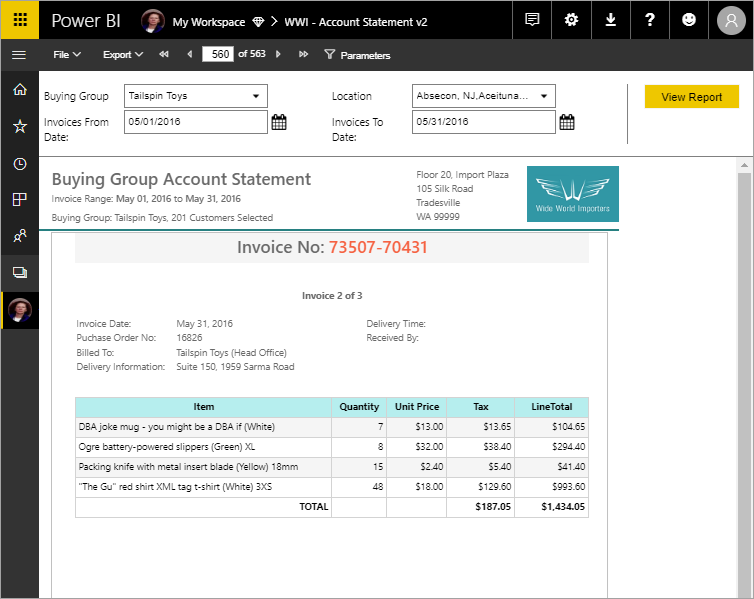
Power BI Paginated Report Builder is a specialized reporting tool designed to create print-ready, pixel-perfect reports for enterprise reporting scenarios. It provides layout precision, supports multiple data sources, and ensures consistent formatting across PDF, Word, and Excel exports.
It builds upon the trusted SQL Server Reporting Services (SSRS) foundation. Unlike interactive Power BI dashboards, it focuses on exact layout control, making it ideal for financial reports, invoices, regulatory documents, and compliance-driven reporting.
The tool bridges traditional reporting reliability with modern Power BI integration for CIOs and data leaders, delivering flexible, governed, and scalable reporting that aligns with enterprise data management standards.
In this blog, we will explore Power BI Paginated Report Builder’s key features, limitations, and best practices, helping you determine how it fits into your enterprise reporting strategy.
What Are the Core Features of Power BI Paginated Report Builder?
1. Ensures Pixel-Perfect Layout:
2. Handles Multi-Page Reports for Large Datasets:
3. Supports Connected, Cross-System Reporting:
It integrates with diverse data sources for unified reporting. You can connect Report Builder to Power BI semantic models, SQL Server, Azure Synapse Analytics, and more, helping CIOs eliminate data silos and support governed, AI-ready reporting environments.
According to a Gartner report, 89% of CEOs say data and AI governance drives innovation, yet only 46% have measure its value. Unified reporting ensures governance translates into business outcomes.
4. Exports Reports Without Losing Formats:
5. Filters Reports Dynamically with Parameters:
6. Supports Security and Compliance:
Improve Your Report Performance and Scalability
Optimize your Report Builder environment for faster load times, stable performance, and enterprise-level data volume.
Request a DemoWhat are the Limitations of Power BI Report Builder?
While Power BI Paginated Report Builder offers exceptional control and compliance-ready design, it also has constraints that organizations must consider when scaling enterprise reporting. Understanding these helps CIOs and data teams balance precision reporting with modern analytics needs.
Here are the current constraints to consider when adopting it:
- Limited Visual Interactivity: Paginated reports focus on print-ready layouts, not on-screen interactivity. Users cannot drill down, slice, or filter visuals dynamically. This makes them ideal for compliance, financial, or operational reporting, less so for real-time analytics or exploration.
- Export Constraints in Certain Formats: While PDF, Word, and Excel exports retain the report’s structure, CSV exports remove headers, subtotals, and styling. Data teams relying on structured exports can impact downstream processing and consistency.
- Data Volume and Rendering Limits: Handling large datasets depends on Power BI Premium capacity. Embedded visuals are limited to 30,000 rows, and gateway queries can time out after 600 seconds if unoptimized. Large-scale enterprises must configure capacities and optimize queries for the best performance.
- Design and Authoring Learning Curve: The Report Builder uses RDL (Report Definition Language), a model inherited from SQL Server Reporting Services (SSRS). Users new to this format may face a learning curve when creating complex groupings, expressions, and parameters.
- Lack of Real-Time Dashboard Features: Paginated reports cannot be pinned to Power BI dashboards or refreshed live. They are static by design and built for precision and consistency rather than live monitoring or data exploration.
How to Work Around These Limitations?
Most of these challenges can be minimized through practical design and implementation steps:
- Use parameters and filters to create dynamic user views.
- Optimize SQL queries and reduce data load for faster rendering.
- Combine Paginated Report Builder with Power BI Desktop for interactive needs.
- Use Power BI Premium capacity to support high data volume scenarios.
By combining best practices and architectural planning, enterprises can maintain layout precision and scalability in their reporting workflows.
How Can Third-Party Integrations Enhance Power BI Paginated Report Builder?
It delivers powerful out-of-the-box reporting, but third-party integrations can extend its capabilities even further.
These integrations improve automation, governance, compatibility, and distribution, helping enterprises manage large-scale reporting more efficiently and effectively.
- Enhanced Data Access: Connect to external platforms like Salesforce, Dynamics 365, and Google Analytics to unify data sources for comprehensive insights.
- Automated Scheduling: Use integration tools such as Power Automate to efficiently schedule and distribute reports across departments.
- Version Control and Governance: Incorporate DevOps or Git integration for managing report versions, approvals, and deployment pipelines.
- Collaboration and Sharing: Integrate with SharePoint or Microsoft Teams to centralize report access and improve communication.
- Visualization Extensions: Leverage third-party visualization libraries or APIs to enhance report visuals beyond native Power BI capabilities.
- Security and Compliance: Integrate with Azure Active Directory or enterprise IAM solutions for controlled report access and audit tracking.
Build a Compliant and Secure Reporting Environment
Ensure your reports meet audit, privacy, and compliance standards with enterprise-grade Power BI configurations.
Request a DemoConclusion
Power BI Paginated Report Builder provides enterprises with the precision, structure, and scalability required for complex, high-stakes reporting. It ensures that every financial, compliance-related, or operational report meets the highest standards of accuracy, presentation, and governance.
Its pixel-perfect layouts, multi-source connectivity, and export versatility remain a cornerstone for organizations prioritizing consistency and reliability in data reporting. While it lacks the interactivity of traditional dashboards, its strength lies in delivering governed, print-ready reports that align with enterprise data strategies.
Our expertise in Power BI implementation and optimization helps enterprises build reporting environments that are both efficient and future-ready, ensuring data remains actionable, secure, and aligned with business goals.
FAQs
Power BI Desktop focuses on interactive dashboards, while Paginated Report Builder is designed for structured, print-ready reports that maintain exact layouts for compliance or financial use cases.
Yes. It’s built for high-volume, enterprise-grade reporting and can efficiently process and render large datasets without performance degradation.
Yes. Publishing and sharing paginated reports through Power BI Service requires a Power BI Premium capacity or Premium Per User (PPU) license.
Explore Recent Blog Posts