From Text to Rating: Automating Sentiment Scoring with Microsoft Fabric

Table of Contents
Introduction
This blog explains how AI-powered sentiment analysis helps organizations make sense of unstructured text such as customer reviews, survey responses, and feedback at scale. It covers how sentiment moves beyond simple positive or negative labels, how nuance and intensity can be measured over time, and how businesses can track sentiment as a real analytics metric rather than a one-off experiment.
Most companies already collect large volumes of text, but that data often goes unused because it is difficult to aggregate, compare, and report on consistently. By applying AI-powered sentiment analysis within a unified analytics environment, teams can translate what people say into trends, benchmarks, and signals that support product decisions, customer experience improvements, and brand monitoring.
What Is Sentiment Analysis and How Does It Support Better Decisions?
S Sentiment analysis is the process of identifying the emotional signals in written text, such as customer feedback, reviews, or survey responses. With AI-powered sentiment analysis, organizations can assess whether sentiment is positive, negative, or neutral and, more importantly, understand how strong those opinions are across large volumes of text.
This matters because text rarely tells a simple story. A single comment can reflect satisfaction with one aspect of an experience and frustration with another. Basic sentiment labels help summarize this complexity, but they do not explain how sentiment changes over time, how it differs by customer segment, or where issues are becoming more severe.
The real value emerges when AI-powered customer sentiment analysis is embedded into broader analytics workflows. When sentiment data is analyzed alongside operational, sales, or customer metrics and surfaced through clear reporting, it becomes easier for teams to spot patterns, prioritize issues, and make decisions based on evidence rather than isolated feedback.
How Does Microsoft Fabric Support End-to-End Sentiment Analytics
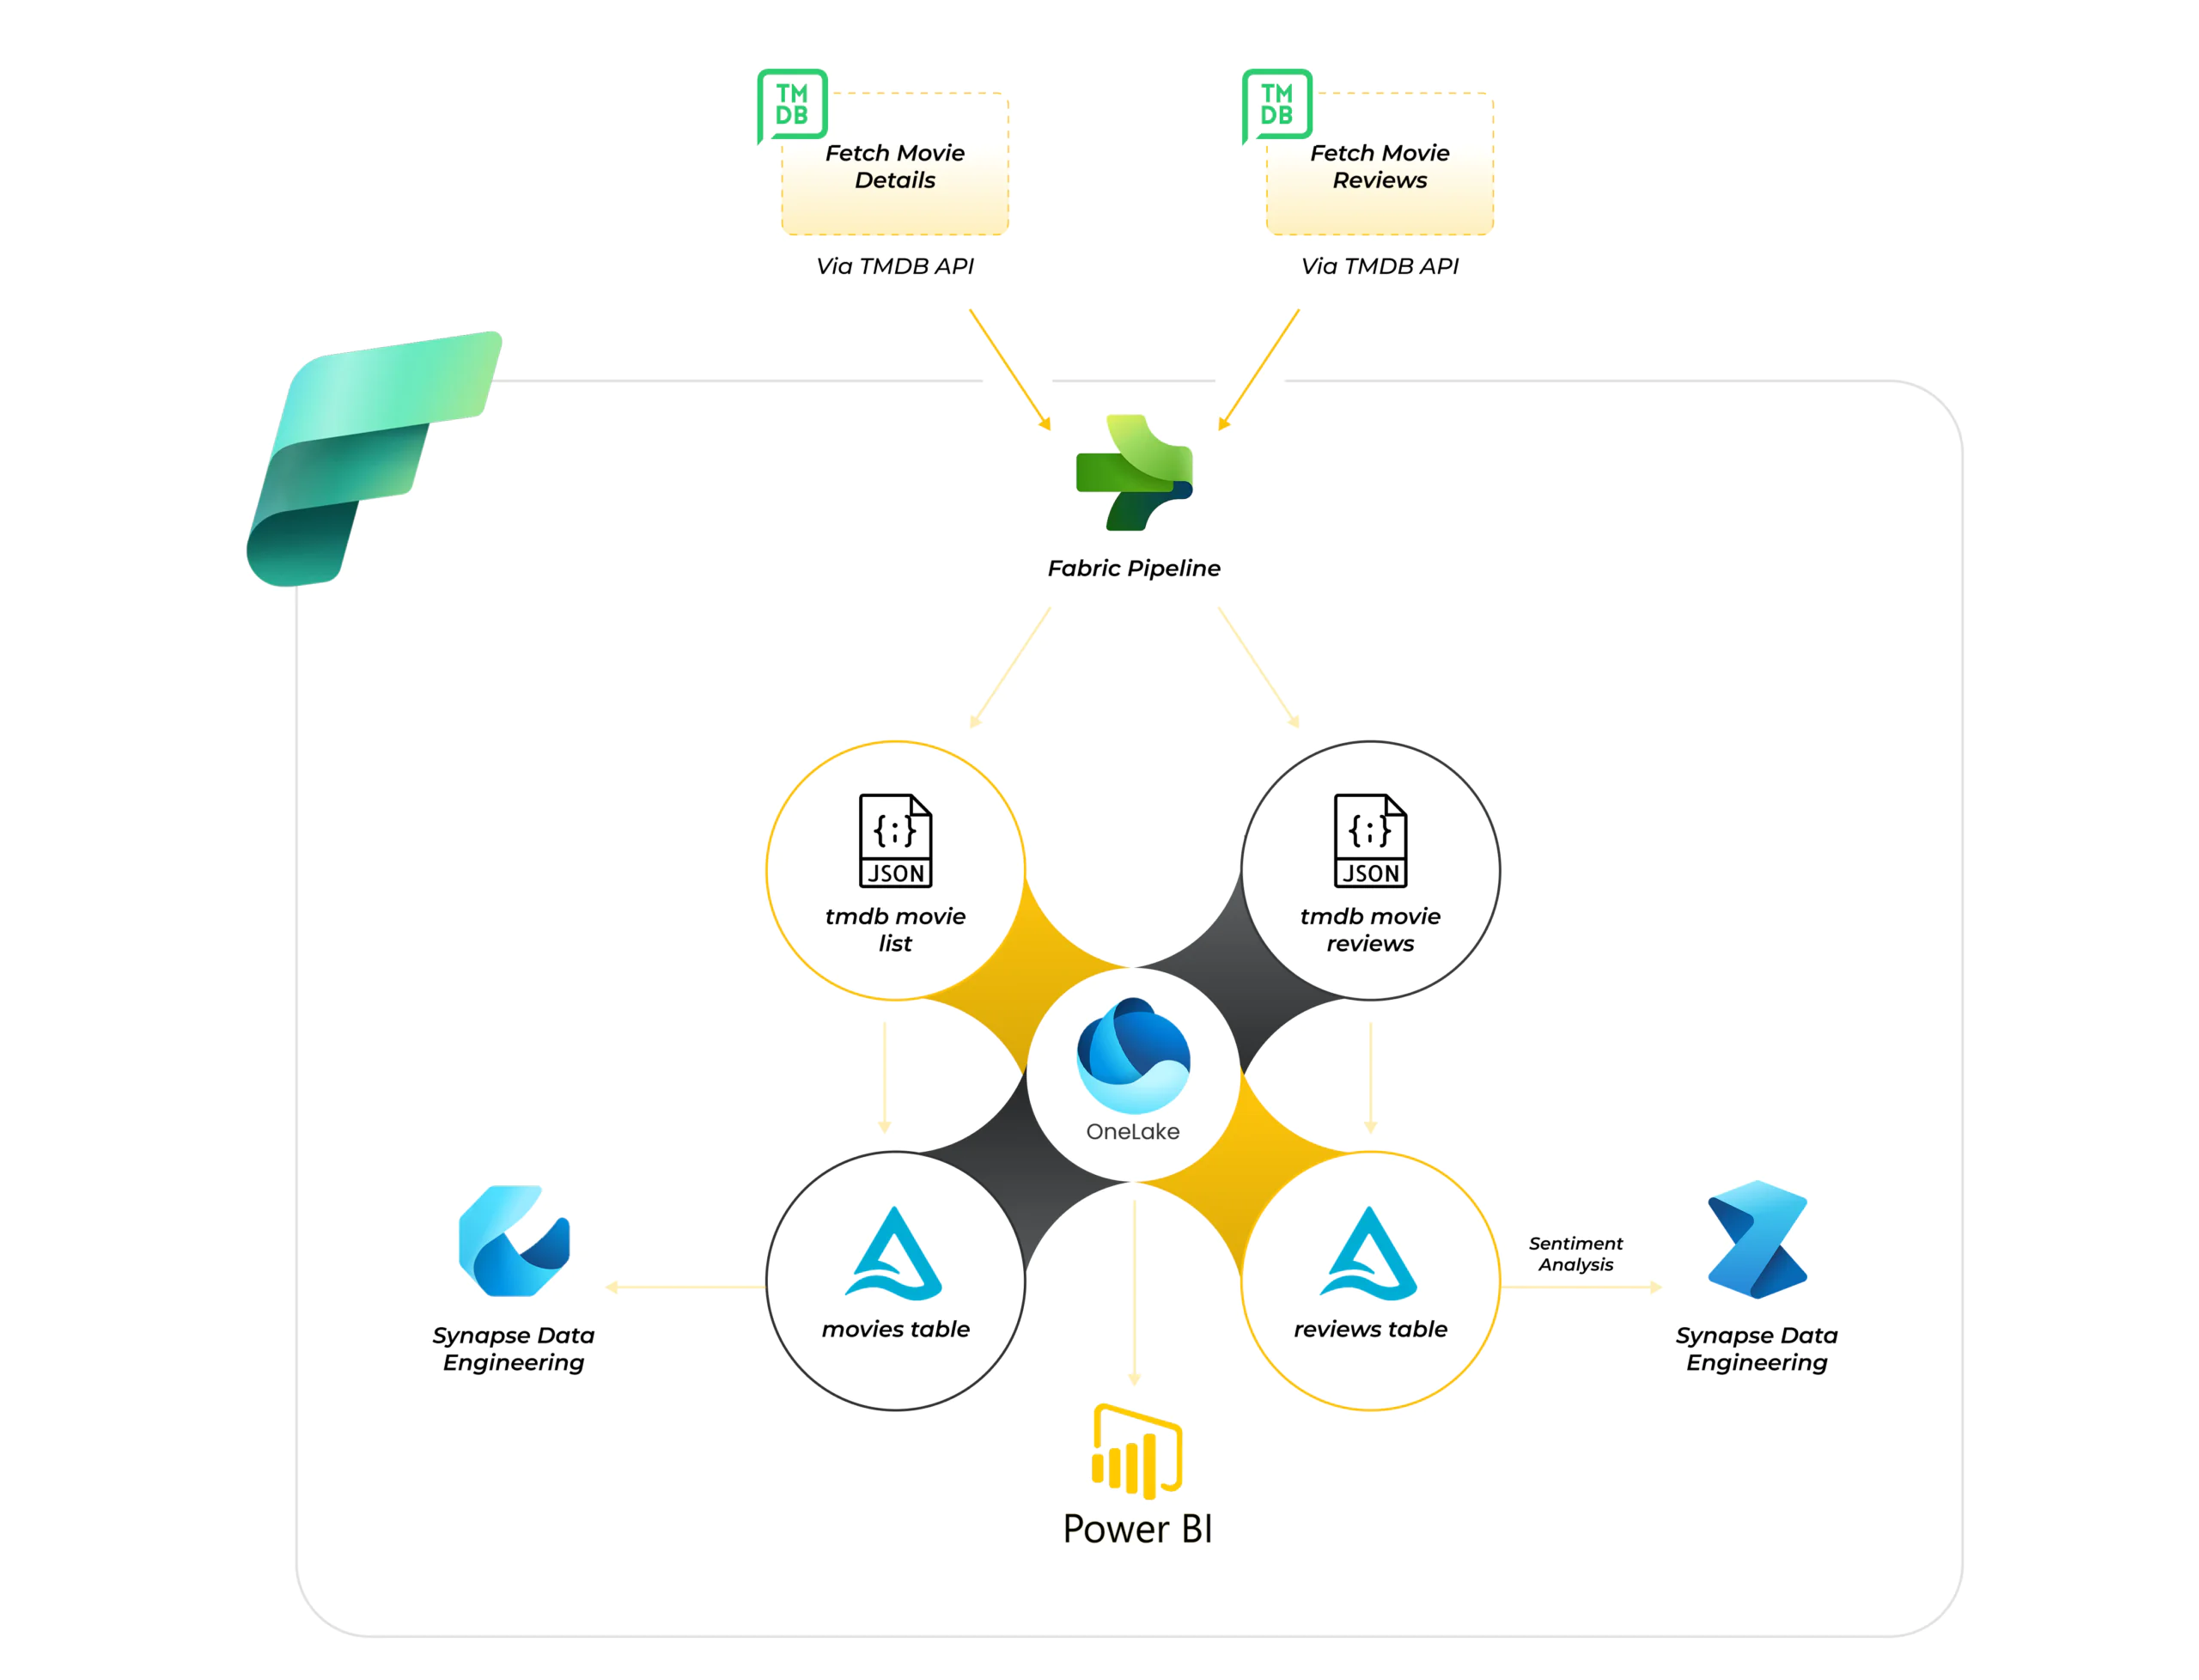
Microsoft Fabric brings together everything required for sentiment analytics into a single, unified platform. Instead of relying on separate tools for data ingestion, processing, analysis, and reporting, Fabric allows these capabilities to work together seamlessly.
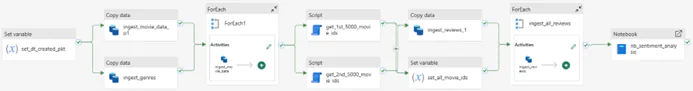
The process begins with Fabric pipelines ingesting data from external or internal source systems and landing it in the Lakehouse in its raw form, preserving the original text for traceability and reprocessing. From there, data engineering capabilities are used to clean, transform, and structure the data into analytics-ready tables while still remaining in the same environment.
Advanced analytics and data science workloads then build on this curated data to enrich it with sentiment insights, such as sentiment scores, labels, or probabilities. All data, raw, transformed, and enriched, continues to reside in the Lakehouse, acting as a single source of truth. Finally, Power BI connects directly to this data to deliver interactive dashboards and reports, ensuring that business users consume consistent, governed, and up-to-date sentiment insights without data duplication or tool fragmentation.
Design a Fabric Pipeline That Converts Reviews into Usable Scores
We’ll map your real text sources, apply sentiment scoring logic, and wire everything into the Lakehouse and Power BI so results are ready for reporting.
Design My Fabric PipelineHow Does Raw API Data Flow into the Lakehouse?
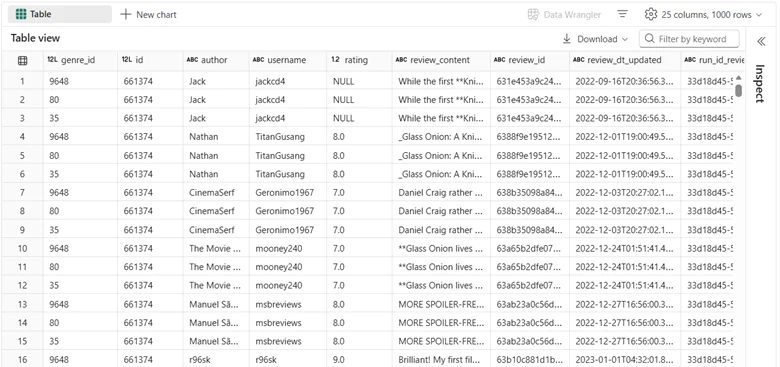
In most real-world scenarios, sentiment data does not start in neat tables. It originates from external systems, often exposed through APIs, that return large volumes of semi-structured text. This could include customer reviews, survey responses, support comments, or public feedback from digital platforms. The data typically arrives in nested JSON formats, spread across multiple pages, and updated continuously.
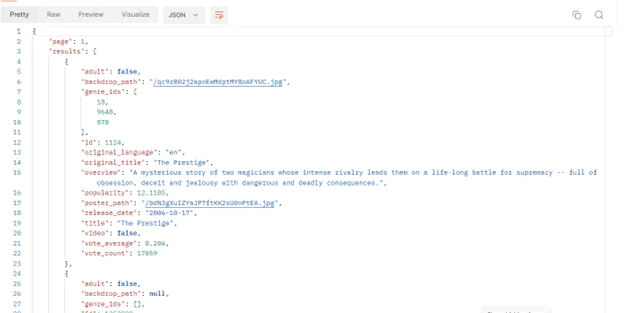
Microsoft Fabric is designed to handle this kind of raw input without forcing early assumptions about structure. Using Fabric pipelines, data from any REST-based API can be brought into the platform and landed directly into the lakehouse. Depending on analytical needs, this data can be preserved in its original form for traceability or written directly into Delta tables using mappings, allowing it to be query-ready from the start.
At this stage, the lakehouse serves as a reliable base for Microsoft Fabric sentiment analysis, holding both raw files and structured tables side by side. This flexibility ensures that text data remains accessible for reprocessing while also being immediately available for transformation, enrichment, and downstream analytics.
You may also like: Warehouse vs Lakehouse in Microsoft Fabric: Key Differences
How Is Raw Text Transformed into Analytics-Ready Data?
Once the data is available in the lakehouse, it can be shaped and enriched using notebooks. This is where unstructured text begins to take on analytical meaning. Nested fields are unpacked, relevant attributes are extracted, and text is standardized so it can be analyzed consistently at scale.
Because notebooks work directly on lakehouse data, transformations stay closely aligned with storage. There is no need to move data between systems or maintain multiple copies of the same dataset. Raw files and transformed Delta tables coexist in the same environment, allowing organizations to retain original data while progressively creating curated, analytics-ready views.
As these transformations are applied, the lakehouse evolves from a simple storage layer into a structured analytical foundation. By the end of this stage, the data is no longer just free-form text; it is organized, structured, and ready to be enriched with sentiment intelligence and consumed by downstream analytics.
You may also like: Microsoft Fabric OneLake: Simplify Data Integration
How Is Text Enriched with Sentiment Intelligence?
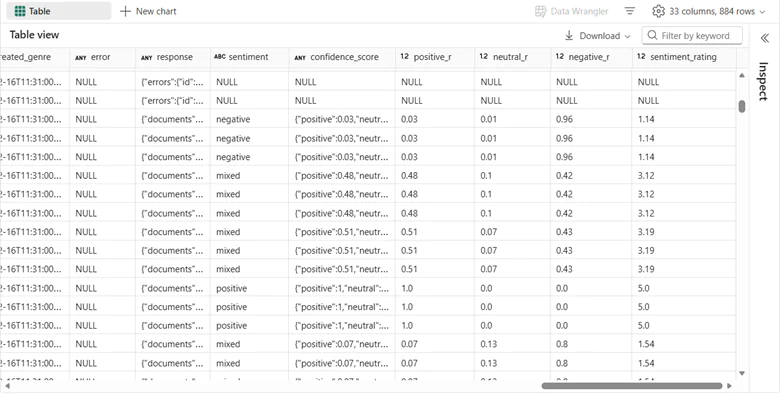
With clean and structured text in place, AI powered sentiment analysis can be applied directly within the same environment. Fabric’s integrated AI capabilities allow text to be enriched with sentiment signals and confidence scores, adding emotional context to each record.
Rather than stopping at labels, sentiment results can be translated into ratings, making opinions measurable. This conversion allows sentiment to be aggregated, compared, and tracked over time, turning qualitative feedback into quantitative insight.
At this point, sentiment is no longer just an interpretation of text; it becomes a reliable metric within the analytics model.
How Does Power BI Bring Sentiment Insights to Life?
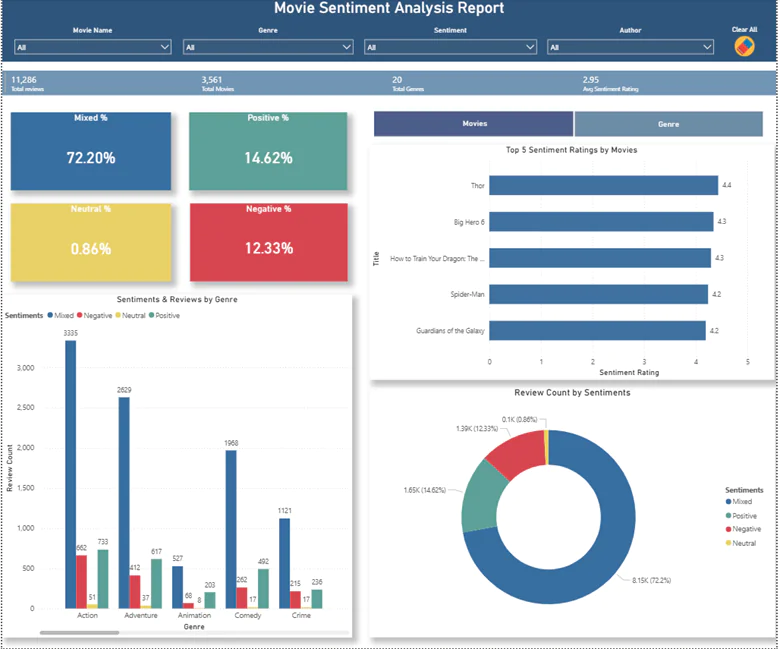
The final step is making these insights accessible. With Power BI integrated into Microsoft Fabric, dashboards can be built directly on top of lakehouse data, eliminating complex data movement or refresh logic.
Sentiment scores and ratings can now be visualized to show trends, distributions, and changes over time. Decision-makers can move from reading individual comments to understanding overall perception at a glance.
This is where the journey from raw text to business insight becomes visible.
Audit Why Your Sentiment Data Isn’t Reaching Power BI Cleanly
We review your ingestion, transformations, and model layer to identify where sentiment data breaks, duplicates, or loses meaning.
Audit My Fabric WorkflowConclusion
Sentiment analysis delivers its greatest impact when it is embedded within the broader analytics ecosystem rather than approached as an isolated capability. Microsoft Fabric supports this by bringing data engineering, AI powered sentiment analysis, and reporting into a single environment. By enabling a seamless journey from raw text to sentiment scores and ultimately to interactive dashboards, organizations can turn subjective feedback into actionable, trusted insights at scale, with consistency, and with confidence.
FAQs
Yes. Fabric is designed to process high-volume text data using pipelines, notebooks, and lakehouse storage without splitting workloads across tools.
They can. Pipelines and notebooks can be scheduled so new reviews or feedback are ingested, scored, and reflected in Power BI with each refresh.
Yes. Fabric’s Lakehouse stores raw text, transformed data, and sentiment outputs side by side, making validation and reprocessing straightforward.
Power BI is the native reporting layer, but sentiment data can also be queried directly for downstream systems if needed.
Yes. Sentiment probabilities or scores can be mapped to numeric scales, making trends and comparisons easier to track over time.
Basic data engineering and notebook experience are helpful, but most complexity sits in designing the right data flow and scoring logic rather than tooling.