Table of Contents
Introduction
Business intelligence tools (BI tools) have become essential in 2026 as deal with growing data volumes and the pressure to make decisions in real time. These tools do more than surface trends. They help teams spot opportunities, improve ROI, and stay ahead in crowded markets.
With machine learning now built into many BI tools, companies can move beyond reporting and start forecasting. By analyzing historical patterns, these tools help predict what is likely to happen next, not just what already happened.
In this guide to the top business intelligence tools, we’ll look at how these solutions help organizations understand customer behavior, improve operational performance, and support stronger, more confident strategic decisions.
How Do Business Intelligence Tools Work?
Business intelligence tools gather data from sources such as files, documents, images, and more. Then they refine, structure, and organize raw data to analyze accurately.
Once processed, the information is presented through reports, visualizations, and interactive dashboards that make complex data easier to interpret. This structured approach allows business leaders to base decisions on patterns, trends, and measurable performance indicators rather than assumptions.
Core functions of BI tools include:
- Data collection from internal and external systems
- Data cleansing and transformation to ensure accuracy and consistency
- Centralized storage for structured analysis
- Creation of reports and real-time dashboards
- Visualization of trends, comparisons, and performance metrics
- Tracking and monitoring of key performance indicators (KPIs)
- Supporting forecasting and trend analysis for informed decision-making
What are the Top Business Intelligence Tools in 2026?
Selecting the right business intelligence platform depends on your data environment, reporting needs, technical maturity, and long-term strategy. Some tools are built for large enterprises managing complex systems, while others focus on usability, visualization, or tight integration with existing ecosystems.
Below are some of the most widely used BI platforms in 2026, along with what they are best known for.
1. SAP BI Tool:
SAP Business Intelligence is a comprehensive suite built for structured data reporting, analysis, and visualization. Its purpose is to transform operational data into usable information that decision-makers can access across teams, locations, and devices.
SAP integrates with Microsoft Office tools such as Excel and PowerPoint, making it easier to create data-backed presentations and blended reports. It supports hybrid environments, linking on-premises systems with SAP cloud platforms. SAP BI is commonly used across CRM, ERP, HR, digital supply chain, and related enterprise functions.
Key Features:
- Enterprise reporting and structured analytics
- Integration with SAP ERP and CRM systems
- Microsoft Excel and PowerPoint connectivity
- Hybrid analytics across on-premises and cloud systems
- Role-based access and governance controls
- Scalable data modeling for large organizations
| Pros | Cons |
|---|---|
|
Strong integration with SAP ecosystem |
Complex setup and configuration |
|
Suitable for large enterprises |
Higher licensing and implementation costs |
|
Supports hybrid cloud and on-premise environments |
Requires skilled technical resources |
|
Deep domain coverage across ERP, CRM, HR, and supply chain |
Less intuitive for non-technical users |
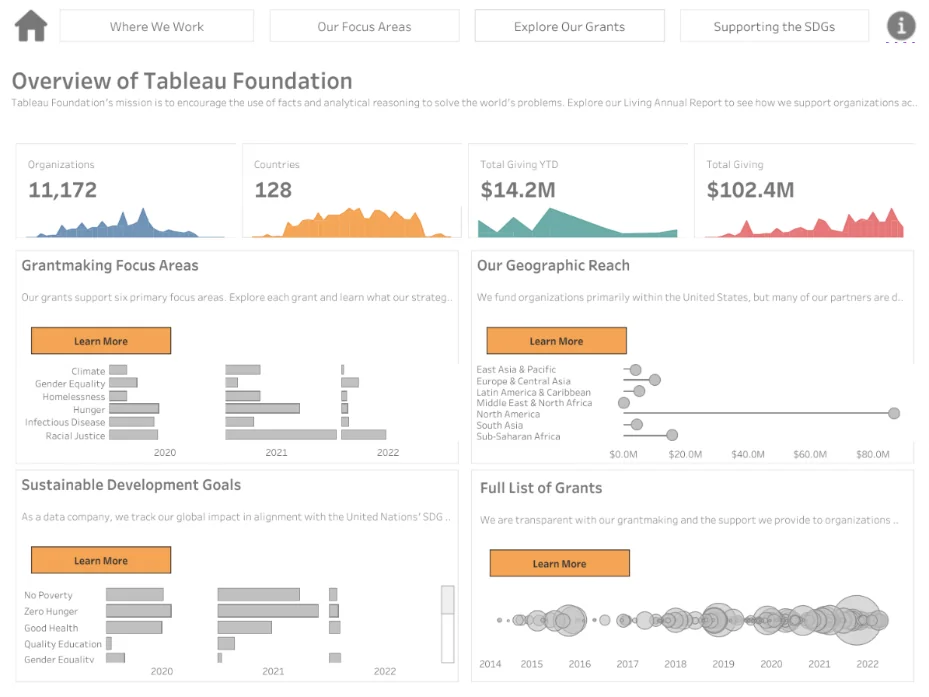
2. Tableau:
Tableau focuses on data exploration and visual analysis. It allows users to work with datasets directly, build charts and dashboards, and share findings without depending heavily on IT teams for every change or update.
The platform connects to a wide mix of data sources, including Microsoft Excel, Salesforce, Oracle databases, and Google Analytics. This broad connectivity makes it suitable for organizations that pull data from multiple systems and need a unified analytical view.
Key Features:
- Drag-and-drop dashboard creation
- Interactive data visualizations
- Self-service analytics capabilities
- Integration with cloud and on-premise data sources
- Real-time data connectivity
- Sharing and collaboration options
| Pros | Cons |
|---|---|
|
Strong visualization capabilities |
Premium pricing for advanced features |
|
Wide range of data source integrations |
Can require performance tuning for large datasets |
|
User-friendly interface for business users |
Advanced analytics may need technical expertise |
|
Supports collaboration and sharing |
Limited native data storage capabilities |
Read more about Power BI vs. Tableau- Which Data Visualization Tool is Right?
Explore Microsoft Power BI With a Trusted Partner!
BI experts at AlphaBOLD can help you solve your business problems and reduce your pain points with specially designed solutions. Want to learn how similar customers have benefited from our experience as business intelligence service providers?
Request a Demo3. Oracle BI:
Oracle BI offers a broad set of analytics and reporting capabilities designed for enterprise environments. It supports structured reporting, ad hoc analysis, and performance monitoring across departments, helping organizations act on data without delay.
The platform includes mobile access, allowing users to review reports and dashboards from different devices. Oracle BI Delivers adds automated monitoring by tracking business activity and sending alerts through email, dashboards, and mobile notifications when predefined conditions are met.
Key Features:
- Enterprise reporting and dashboarding
- Ad hoc query and analysis tools
- Mobile-enabled access to reports and metrics
- Oracle BI Delivers for automated alerts
- Integration with Oracle databases and applications
- Role-based access and governance controls
| Pros | Cons |
|---|---|
|
Strong fit for Oracle-based environments |
Implementation can be complex |
|
Advanced alerting and monitoring capabilities |
Higher total cost for enterprise deployment |
|
Mobile access to dashboards and reports |
Requires experienced administrators |
|
Scalable for large data environments |
Interface may feel dated compared to newer BI tools |
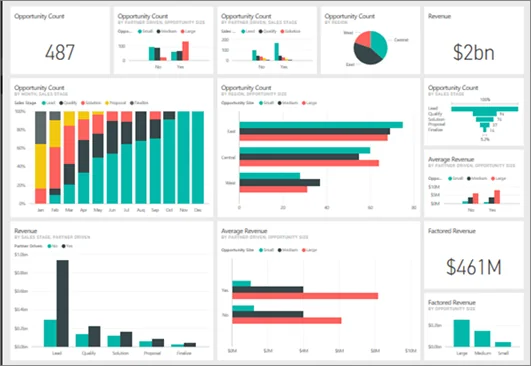
4. Microsoft Power BI:
Microsoft Power BI is a robust business intelligence platform from Microsoft that combines advanced data analysis with intuitive visualization. It allows organizations to connect multiple data sources, clean and transform information, and build a unified data model for reporting and analytics.
Users can create interactive charts, graphs, and dashboards to clearly visualize trends and patterns. Reports and dashboards can be securely shared across teams, helping decision-makers collaborate and act on insights quickly.
Key Features:
- Connects to diverse data sources, including Excel, Azure, and cloud applications
- Data transformation and modeling capabilities
- Interactive dashboards and visual reports
- Secure sharing and collaboration across the organization
- Real-time monitoring and updates
- AI-driven insights and analytics
| Pros | Cons |
|---|---|
|
Strong integration with Microsoft ecosystem |
Large datasets may require performance optimization |
|
Easy-to-use interface for report creation |
Advanced features can require learning DAX formulas |
|
Real-time data visualization and monitoring |
Governance setup requires planning |
|
Scalable for small to enterprise-level deployments |
Custom visualizations may need additional configuration |
Want to know more about Power BI’s limitations, performance bottlenecks, and best practices? Head over to our recent blog: Performance and Limits of Power BI.
Customize Power BI solutions to gain visibility across your organization
We integrate Power BI with your systems, customize reports to your needs, and manage dashboards so your team can focus on insights instead of setup.
Talk to an Expert5. MicroStrategy:
Microsoft Power BI is developed by Microsoft and is widely used across enterprises of all sizes. It combines data analysis and visualization in a single platform, allowing organizations to work with structured and unstructured data from multiple sources.
Power BI connects to various systems, cleans and transforms datasets, and brings them into a unified data model. Users can build charts, graphs, and interactive dashboards, then share reports securely with other Power BI users across the organization.
Key Features:
- Integration with Microsoft products such as Excel and Azure
- Data transformation and modeling capabilities
- Interactive dashboards and visual reports
- Cloud and on-premises deployment options
- Secure report sharing within the organization
- Real-time data monitoring
| Pros | Cons |
|---|---|
|
Strong integration with the Microsoft ecosystem |
Advanced features may require licensing upgrades |
|
Cost-effective for many organizations |
Large datasets can impact performance without optimization |
|
User-friendly interface for report creation |
Customization may require DAX knowledge |
|
Supports real-time analytics |
Governance setup needs careful configuration |
6. ZOHO ANALYTICS:
Zoho Analytics helps business users connect, prepare, and analyze their data with minimal technical effort. It enables the creation of clear, visually appealing dashboards and reports that quickly reveal trends and insights.
Collaboration is built into the platform through a dedicated commenting feature, making it easier for teams to discuss data findings. Zoho also integrates data from multiple business applications via pre-built connectors, enabling cross-departmental reporting and consolidated insights.
Key Features:
- Data connection and preparation tools
- Interactive dashboards and visualizations
- Collaboration through in-report commenting
- Integration with multiple business applications
- Cross-department reporting and merged insights
- Automated reporting and scheduled data refresh
| Pros | Cons |
|---|---|
|
Easy-to-use interface for non-technical users |
Limited advanced analytics compared to enterprise platforms |
|
Strong collaboration features |
Performance may lag with very large datasets |
|
Pre-built connectors for multiple apps |
Customization options can be limited |
|
Cross-department reporting capabilities |
Less enterprise-level governance and security features |
7. Domo:
Domo is a fully cloud-based BI platform that pulls data from multiple sources, including spreadsheets, databases, and social media. Its drag-and-drop ETL interface lets users combine and transform data without writing code.
The platform supports data lakes, warehouses, and ETL tools, and it can work with R or Python scripts for advanced predictive modeling. Domo connects data across the enterprise, offers AI and machine learning features, and enables users to explore and analyze data independently.
Key Features:
- Cloud-based data integration from multiple sources
- Drag-and-drop ETL for easy data preparation
- Support for R and Python scripts
- AI and machine learning analytics
- Enterprise-wide data connectivity
- Interactive dashboards and self-service analytics
| Pros | Cons |
|---|---|
|
Entirely cloud-based with easy deployment |
Pricing can be high for large organizations |
|
Simple ETL without coding |
Learning curve for advanced predictive features |
|
Supports integration with R/Python |
Limited offline capabilities |
|
AI and machine learning tools built-in |
Customization of visuals can be less flexible |
8. IBM COGNOS ANALYTICS:
IBM Cognos Analytics is designed to help users analyze data quickly and make informed decisions with confidence. The platform leverages AI to provide insights into business performance relative to peers and to identify trends and potential opportunities.
It combines reporting, dashboards, and predictive analytics in a single interface, allowing organizations to monitor performance, uncover patterns, and plan strategically.
Key Features:
- AI-powered data insights and predictions
- Interactive dashboards and reporting
- Performance benchmarking against industry peers
- Predictive analytics for trend identification
- Data visualization and storytelling tools
- Self-service analytics for business users
| Pros | Cons |
|---|---|
|
Strong AI-driven insights and forecasting |
Can be complex to implement for smaller teams |
|
Comprehensive reporting and visualization |
Higher licensing and maintenance costs |
|
Performance benchmarking features |
Interface may feel overwhelming for beginners |
|
Combines predictive analytics with standard reporting |
Customization options can be limited |
9. Metabase:
Metabase is an open-source BI server built for simple setup and quick database connectivity. It integrates with data sources such as MySQL, PostgreSQL, and MongoDB, allowing teams to start querying data without complex configuration.
The interface is straightforward and designed for business users. Teams can build charts and dashboards, then share them securely with colleagues and stakeholders to support clearer, data-backed decisions across the organization.
Key Features:
- Open-source and self-hosted options
- Integration with MySQL, PostgreSQL, MongoDB, and other databases
- Simple installation and configuration
- User-friendly query builder
- Interactive dashboards and visualizations
- Secure sharing and access controls
| Pros | Cons |
|---|---|
|
Open-source and cost-effective |
Limited advanced analytics compared to enterprise tools |
|
Easy database integration |
Fewer built-in predictive features |
|
Clean and simple interface |
Requires internal hosting and maintenance |
|
Quick setup for small to mid-sized teams |
Customization may need technical expertise |
10. Looker:
Looker is a cloud-based business intelligence platform built for data exploration and analysis. It is now part of Google Cloud, which strengthens its integration with cloud data infrastructure and services.
Using its data modeling language, LookML, users can define metrics, manage business logic, and examine relationships across datasets consistently. The platform also includes storytelling features that help teams present analysis through structured visualizations tailored for stakeholders.
Key Features:
- Cloud-native architecture
- LookML data modeling language
- Centralized metric definitions
- Integration with Google Cloud services
- Interactive dashboards and visualizations
- Data storytelling and sharing tools
| Pros | Cons |
|---|---|
|
Strong cloud integration, especially with Google Cloud |
Requires familiarity with LookML for full use |
|
Centralized data modeling for metric consistency |
Pricing may be high for smaller teams |
|
Supports scalable data environments |
Setup can be complex |
|
Built-in storytelling capabilities |
Less flexible for non-technical users initially |
Read more about Looker Studio vs. Power BI for NetSuite: A Comparative Analysis

11. Yellowfin:
Yellowfin is an analytics suite that combines action-oriented dashboards with automated analysis and built-in data storytelling. It brings reporting, collaboration, and guided insights into a single environment that connects analysis with day-to-day decision-making.
The platform supports data analysts, business users, customers, and developers who need to create, deploy, or embed analytics into applications. Its focus is on making insights easier to interpret and act on within operational workflows.
Key Features:
- Action-based dashboards
- Automated data analysis and alerts
- Built-in data storytelling tools
- Embedded analytics capabilities
- Collaboration and discussion features
- Support for developers and application integration
| Pros | Cons |
|---|---|
|
Combines dashboards with automated insights |
Smaller ecosystem compared to larger BI vendors |
|
Strong storytelling and collaboration features |
Advanced customization may require technical skills |
|
Supports embedded analytics |
Licensing costs can vary by deployment scale |
|
Suitable for multiple user types |
Less brand recognition in some markets |
12. SAS BI:
SAS BI provides a comprehensive set of tools for turning raw data into actionable insights that support business decisions. It is widely used in enterprise environments where analytics must support functions such as CRM, ERP, and supply chain operations.
The platform supports integration across on-premises and cloud systems, creating a flexible environment for reporting and analysis. Organizations that require advanced statistical capabilities and structured governance often rely on SAS BI for enterprise-grade analytics.
Key Features:
- Advanced analytics and statistical modeling
- Enterprise reporting and dashboards
- Integration with enterprise systems such as CRM and ERP
- Support for on-premises and cloud deployments
- Strong data governance and security controls
- Scalable architecture for large datasets
| Pros | Cons |
|---|---|
|
Advanced statistical and analytical capabilities |
Higher cost compared to many BI tools |
|
Strong governance and compliance features |
Requires skilled analysts to use fully |
|
Suitable for large, complex environments |
Implementation can be time-intensive |
|
Scalable for enterprise data volumes |
Interface may feel complex for business users |
13. Datapine:
Datapine is a business intelligence platform that helps organizations explore, analyze, visualize, and share company data in a single environment. It brings reporting and dashboarding together so teams can work from a consistent analytical view.
The interface uses drag-and-drop functionality, making it accessible to users without technical backgrounds. Datapine also applies advanced analytics and machine learning techniques to identify patterns and trends within datasets.
Key Features:
- Unified analytics and reporting platform
- Drag-and-drop dashboard builder
- Interactive data visualizations
- Advanced analytics and trend analysis
- Machine learning-based pattern detection
- Secure data sharing and collaboration
| Pros | Cons |
|---|---|
|
Easy to use for non-technical users |
Limited enterprise-scale capabilities |
|
Built-in advanced analytics features |
Fewer integrations compared to larger vendors |
|
Centralized reporting and dashboards |
Customization options can be restricted |
|
Supports collaboration and sharing |
May not suit highly complex data environments |
14. Sisense:
Sisense is built to help organizations turn complex data into clear insights that support business decisions. It focuses on presenting data in visual formats that are easy to interpret across different teams and stakeholders.
The platform includes a drag-and-drop interface and interactive dashboards that simplify analysis, even with large, complex datasets. This makes it suitable for both technical and business users who need fast access to meaningful information.
Key Features:
- Interactive dashboards and visual analytics
- Drag-and-drop report building
- Support for large and complex datasets
- Embedded analytics capabilities
- Integration with multiple data sources
- Data modeling and transformation tools
| Pros | Cons |
|---|---|
|
Handles complex datasets efficiently |
Licensing can be expensive |
|
User-friendly dashboard creation |
Advanced customization may require technical skills |
|
Strong embedded analytics support |
Learning curve for deeper data modeling |
|
Flexible deployment options |
Smaller ecosystem compared to major vendors |
15. Dundas BI:
Dundas BI is a browser-based business intelligence platform with over two decades of market presence. It allows users to analyze and visualize data directly through a web interface, reducing reliance on IT teams for routine reporting needs.
The platform includes drag-and-drop functionality for building dashboards and reports. It is known for its flexibility, interactive visual analytics, and the ability to tailor dashboards to specific business requirements.
Key Features:
- Browser-based analytics platform
- Drag-and-drop dashboard and report builder
- Interactive data visualizations
- Customizable dashboards and layouts
- Data modeling and transformation tools
- Integration with multiple data sources
| Pros | Cons |
|---|---|
|
Long-standing presence in the BI market |
Interface may feel less modern compared to newer tools |
|
Flexible and customizable dashboards |
Advanced configuration can require technical expertise |
|
Web-based access without heavy installation |
Smaller market share than major BI vendors |
|
Supports interactive reporting |
Pricing can vary based on deployment needs |
16. Qlik Sense:
Qlik Sense is a business intelligence platform built around an associative data model. This approach allows users to explore relationships across multiple data sources without being limited to predefined queries. Instead of following fixed report paths, users can move freely through datasets and uncover connections that might otherwise remain hidden.
The platform supports interactive dashboards and shareable reports, as well as integration across cloud platforms, big data environments, and enterprise systems. It also incorporates AI-driven analytics to support pattern detection and generate recommendations. Qlik Sense is often chosen for its scalability, usability, and ability to manage large data volumes across departments.
Key Features:
- Associative data modeling
- Free-form data exploration
- Interactive dashboards and reports
- Integration with cloud and big data platforms
- AI-assisted analytics and insights
- Scalable architecture for large datasets
| Pros | Cons |
|---|---|
|
Flexible data exploration without fixed queries |
Initial setup can require data modeling expertise |
|
Handles large and complex datasets effectively |
Licensing costs may be high for full capabilities |
|
Strong integration with multiple data sources |
Learning curve for advanced features |
|
AI-assisted insights and recommendations |
Interface may require training for new users |
Maximize Your BI Investment with Tailored Solutions
Work with our BI experts to transform your data into insights that deliver real results. Streamline reporting, improve operations, and make faster, more informed decisions across your business.
Request a DemoConclusion
Business intelligence tools now play a central role in how organizations monitor performance, analyze trends, and plan strategy. Each platform offers a different mix of strengths, whether in visualization, advanced analytics, enterprise integration, or cloud scalability. The right choice depends on your data environment, reporting needs, and internal capabilities.
Before making a decision, define your objectives, user requirements, and governance standards. Compare integration options, scalability, and total cost. A well-selected BI tool supports accurate reporting, faster decisions, and consistent performance tracking across the organization.
FAQs
Consider your existing systems, data complexity, number of users, reporting needs, and scalability requirements. Evaluate integration capabilities, ease of use, support, and total cost of ownership to find the best fit.
Yes. Many modern BI platforms can process unstructured data using AI or machine learning, enabling analysis of text, documents, images, and social media data.
Cloud BI tools offer easier deployment, remote access, and automatic updates, while on-premises solutions give more control over security and data storage. The choice depends on your IT policies and data governance needs.
BI platforms often include shared dashboards, commenting, notifications, and report-sharing features, allowing multiple users to review, analyze, and act on the same data in real time.
Most BI tools offer role-based access controls, encryption, audit logs, and compliance with industry standards, ensuring sensitive data remains protected while accessible to authorized users.
Explore Recent Blog Posts