Introduction
As business success solely hinges on data-driven decisions, the last thing business leaders and decision-makers want to do is toggle among multiple systems like Looker Studio Vs Power BI to manage key business processes.
Integrating data visualization tools — “where data analysis occurs within a user’s natural workflow” aims to change that.
For NetSuite users, Google Data Studio, now known as Looker Studio, and Microsoft Power BI are excellent options to leverage ERP analytics. ERP systems are built for the specific purpose of ingesting data and are part of a rigid data structure by design. At an ERP’s core, there’s a general ledger and sub-ledger structure built for specific accounting purposes. This ultimately limits the reporting flexibility that your FP&A teams and stakeholders want.
What now? Now, businesses turn to data visualization tools like Google Looker Studio and Power BI to optimize their data model. Realizing accurate insights, users gain real-time visibility to pinpoint issues, trends, and opportunities and instantly drill down to decision-making.
This comparative analysis of Looker Studio Vs Power BI will help users to evaluate the two tools based on several factors such as pricing, user interface, data transformation, deployment options, and functionalities.
Looker Studio Vs Power BI: The Two Well-received BI Tools in the Market
Looker Data Studio
Looker Studio is a cloud-based visualization tool designed to assist users in creating streamlined and visually appealing reports through interactive dashboards. This platform seamlessly integrates with various Google services such as Google Ads, Google BigQuery, and Google Analytics.
Benefiting from Google’s user-friendly interface, Looker Studio primarily targets non-technical users, empowering them to visualize data effectively. With 17 native connectors provided by Google and additional connectors from Google’s partners (mostly available through paid options), users can establish connections to data sources within Looker Studio. Users can effortlessly generate charts, tables, and other visual elements using a simple point-and-click approach. These components can be combined to construct interactive reports, which can be easily shared with team members or clients.
Power BI
Microsoft Power BI is a user-friendly software developed by Microsoft that focuses on analyzing business data and presenting it in a visually engaging manner. It serves as a bridge between users and multiple sources, allowing users to easily connect and retrieve data from various systems such as databases, spreadsheets, cloud services, and more.
Once connected, Power BI offers powerful data transformation and shaping capabilities. This means users can clean, organize, and structure their data to ensure accuracy and relevance. This step sets the foundation for generating insightful reports and dashboards.
One of the best aspects of Power BI is report and dashboard creation. These reports are dynamic and interactive, meaning users can click on different elements to drill down into specific details or switch between different views. Visualizations such as charts, graphs, maps, and tables make it easy to comprehend trends, patterns, and relationships within the data.
With power BI service users can share their reports and dashboards with others, either within their organization or externally. This is particularly useful for collaboration and decision-making. Additionally, Power BI service offers the ability to schedule data refreshes, ensuring that the information presented is up-to-date and accurate.
Looker Studio Vs Power BI: Pricing
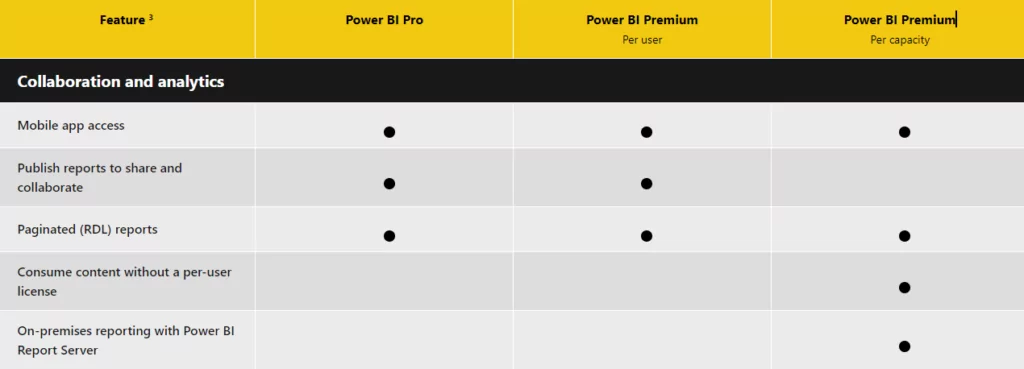
Power BI Pricing:
When comparing Looker Studio Vs Power BI, know that Power BI has multiple pricing tiers based on user type, capacity, deployment options and features:
| Feature | Power BI Insights Advanced Capabilities |
|---|---|
|
Power BI Desktop |
With the Power BI Free plan, users can download and use Power BI Desktop app for free. You can use all the analytical features available on the desktop. Power BI Desktop is typically used for personal or individual use because you can not share the reports in this pricing tier. |
|
Power BI Pro |
Power BI Pro starts with 9.99$ USD/per month, you can publish reports to the Power BI service, collaborate with other users, and share content securely. Each user with a Power BI Pro license can create and share content. |
|
Power BI Premium |
Power BI Premium offers enhanced performance, dedicated cloud capacity, and additional features for organizations with more demanding BI needs. It is suitable for larger enterprises or those requiring higher data capacity and performance.
– $20 per user/month
– $4,995 per capacity/month |
|
Power BI Embedded |
This is designed for developers who want to embed Power BI dashboards and reports into custom applications or websites. Power BI Embedded is also licensed on a capacity basis. |
Discover Why Power BI Is The Right Choice in Google Looker Studio vs Power BI Comparison
Unlock the full potential of Power BI with expert guidance. Let AlphaBOLD take you on an explorative journey of how we can optimize your processes with Power BI.
Request a DemoLooker Studio Pricing Model:
Google Data Studio acquired Looker in 2020 and offers it as a product under its umbrella. Since then, Google trades broadly on the premise that Looker Studio is open source. But as you might have guessed, that’s not entirely true.
Individuals using free Looker Studio version can only extract data from a limited range of sources. As of Q1 2023, users can only pull data for free from the following sources:
- File Upload
- Google Ads
- Google Ad Manager 360
- Google Analytics
- Google Cloud Storage
- Google Sheets
- Amazon Redshift
- BigQuery
- Campaign Manager 360
- Cloud SQL for MySQL
- Cloud Spanner
- Display & Video 360
- Extract Data
- Google Surveys
- MySQL
- Microsoft SQL Server
- PostgreSQL
- Search Ads 360
- Search Console
- YouTube Analytics
Notice something common about these sources? All these platforms are provided by Google itself.
Before we go any further, let’s discuss if Google will eliminate the free aspects now that it has become Looker Studio? Till now Google hasn’t announced anything in this regard, so it’s safe to say that they will continue to market Looker as a “free” solution for marketers.
However, Google has been known to phase out products in the past such as YouTube Originals, Hangouts, and the Google My Business App. Therefore, its better not to count anything out when comparing Looker Studio Vs Power BI. It’s more likely that they will put resources into upgrading Looker Studio Pro, while Looker Studio will be used as an entry point.
Functionalities Breakdown: Looker Studio Vs Power BI Service
| Functionality | Looker Studio | Power BI |
|---|---|---|
|
Data Visualization |
In Looker users can create custom visualizations. It provides extensive visualization capabilities with real-time analysis. |
Power BI supports about 3,500 data points. Users can personalize the visualization pane by adding or removing Power BI visuals. Resetting the pane restores the default visuals. |
|
Data Volume |
Looker’s data querying is primarily structured through the explore page, where a query has a maximum threshold of 5000 rows. This limitation encourages a focused approach to data analysis. |
Microsoft Power BI handles data storage and analysis with a more extensive capacity, providing up to 10 GB of storage per user. Data access can be established directly from the source database, facilitating efficient and comprehensive data retrieval. To manage potentially vast volumes of data during visualization, Power BI service utilizes data reduction strategies tailored to different types of visualizations. |
|
CRM Integration |
Looker doesn’t have free connectors for CRM systems. |
Compared to Looker Studio vs. Power BI integrates relatively well with Microsoft Dynamics CRM |
|
Data Modeling |
Looker offers a wide range of capabilities using its own language called LookML. With LookML, data analysts can define relationships between various tables and sources as well as creating custom calculations and dimensions based on the business requirements. |
Similar to Looker, Microsoft Power BI has its own data modeling language and it’s called Data Analysis Expression (DAX). Using DAX, you can define relationships and create calculated columns and measures. |
BOLDSuite Analytics: How Does it Stand out from Other Power BI Connectors
Businesses can double the power of NetSuite analytics with BOLDSuite analytics for self-service BI. This Power BI connector is designed to be cost-effective, flexible, fast, and intuitive. With pre-built Dashboards and uncomplicated configuration options, it facilitates an actionable analysis of user data. This type of connector empowers technical and non-technical users to engage in data-driven decision-making and uncover opportunities for growth and optimization.
Comparing, Looker Studio and BOLDSuite Analytics for Power BI, presents a valuable opportunity for businesses to explore the optimal solution for their data analytics needs. While both platforms offer distinct advantages, the decision ultimately revolves around aligning capabilities with the specific goals and requirements of the organization.
| Aspect | BOLDSuite Analytics | Looker Studio |
|---|---|---|
|
Purpose and Data Integration |
NetSuite-focused Power BI connector |
A comprehensive data exploration and visualization platform supports various data sources. |
|
Reporting and Dashboarding |
Predefined NetSuite-specific dashboards |
Highly customizable and interactive reports and dashboards. |
|
Data Scale and Performance |
Native handling for large NetSuite datasets |
Scalable architecture for diverse and substantial data. |
|
Ease of Use and Learning Curve |
Emphasis on ease of use for NetSuite users |
Customization capabilities may entail a steeper learning curve. |
|
Cost and Accessibility |
Provided at no additional cost to NetSuite customers |
Pricing varies based on usage and is adaptable to different budgets. |
In the realm of data analytics solutions, the comparison between Looker Studio and BOLDSuite Analytics unmistakably positions the latter as a superior choice for businesses seeking to optimize their NetSuite analytics journey. BOLDSuite Analytics stands out for its seamless integration with NetSuite and Power BI and its remarkable cost-effectiveness, flexibility, and user-friendliness. By providing pre-built Dashboards and a streamlined configuration process, BOLDSuite Analytics empowers technical and non-technical users to extract actionable insights from data effortlessly.
This Power BI connector’s tailored focus on NetSuite-related metrics ensures businesses can swiftly access targeted, ready-to-use reporting solutions. In essence, BOLDSuite Analytics is the solution that enhances analytics and propels organizations towards smarter decision-making, fostering growth and delivering unparalleled value.
Make A Switch to Power BI Today!
Let AlphaBOLD help you leverage the true potential of Power BI.
Request a DemoLooker Studio Vs Power BI: Key Takeaways
Both Looker Studio and Power BI service offer equally reliable and high-end features with slight pricing and deployment options variations. When comparing data analytics tools like Looker Studio Vs Power BI, it’s essential to consider the specific features and capabilities that meet your organization’s needs. Looker Studio offers a unique approach to data exploration and modeling, while Power BI is known for its user-friendly interface and powerful reporting capabilities.
One key aspect to evaluate in the Looker Studio and Power BI comparison is data connectivity. Power BI service provides seamless integration with various data sources, including databases, spreadsheets, and cloud services. This connectivity ensures that you can easily access and retrieve data from multiple systems, a crucial factor to consider in the Looker Studio Vs Power BI decision.
If you’re already familiar with other Microsoft products, Power BI might be a better choice, as you’ll find the user experience compatible with other Microsoft products. Moreover, Gartner graded Power BI as the top tool “Magic Quadrant for Analytics and Business Intelligence Platforms.”
Additionally, for NetSuite users seeking to optimize their analytics, BOLDSuite Analytics for Power BI emerges as a cost-effective and user-friendly solution. Its focus on NetSuite-related metrics and pre-built dashboards makes it a compelling choice for businesses aiming to extract actionable insights effortlessly
Ultimately, the decision between Looker Studio Vs Power BI rests upon an organization’s unique requirements, existing technology stack, and strategic priorities. As the business intelligence landscape continues to evolve, businesses are presented with many options that can be tailored to their specific goals and preferences.
Explore Recent Blog Posts