


Table of Contents
Introduction
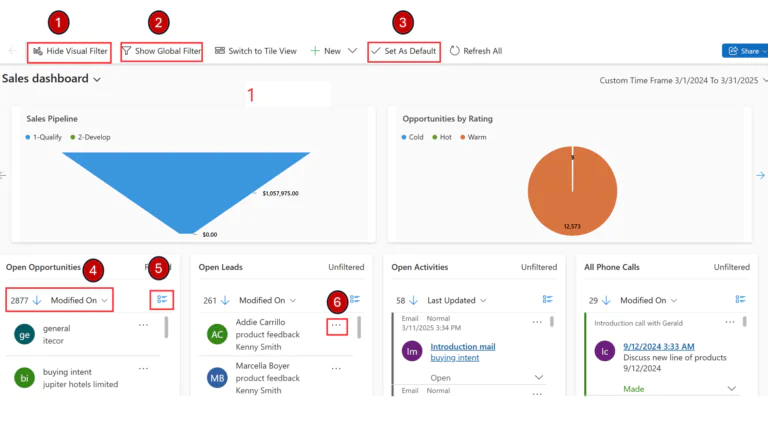
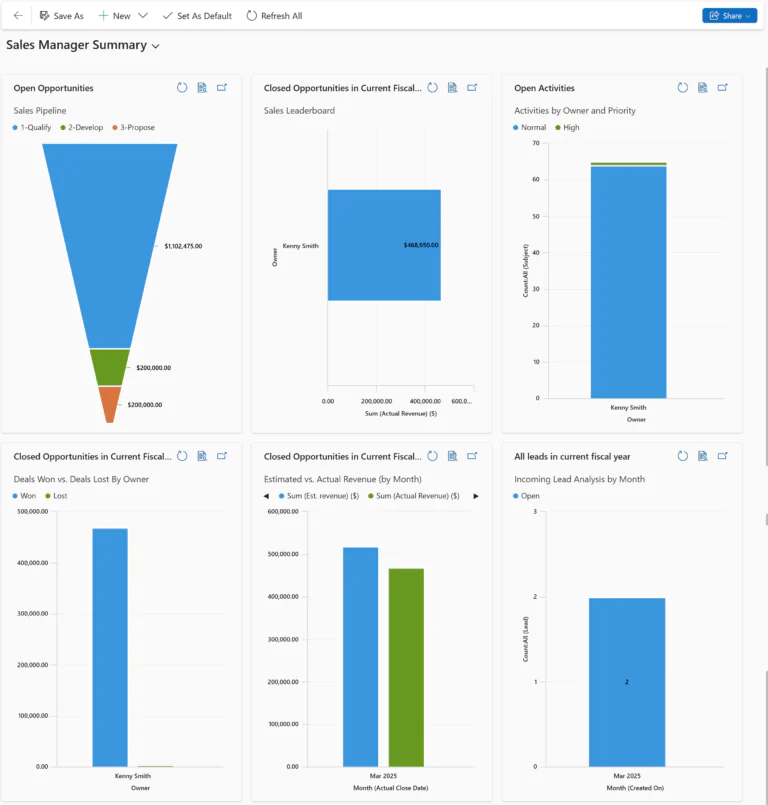
The D365 Sales dashboard is designed to give organizations a clear view of pipeline performance, forecasting, and sales activity. In practice, most companies already have dashboards in place. The challenge is not access to data, but how that data is structured, interpreted, and used in daily sales decisions.
From our experience working with sales teams, a consistent pattern emerges. Dashboards exist, but they are underutilized, overloaded with metrics, or disconnected from how sales teams actually operate. As a result, forecasting becomes inconsistent, deal risks are identified too late, and leadership lacks a reliable view of pipeline health.
The gap is not in the technology. It is in how the dashboard is implemented, aligned to business processes, and adopted across teams.
What the D365 Sales Dashboard Is Designed to Do
The D365 Sales dashboard is built to provide a centralized view of sales performance, enabling teams to track pipeline movement, assess deal progress, and make informed decisions based on real-time data. When implemented correctly, it serves as the foundation for both operational visibility and strategic forecasting.
At its core, the dashboard supports several key functions:
- Pipeline visibility across opportunities
Provides a clear view of deal stages, progression, and pipeline health, helping teams identify bottlenecks and prioritize high-impact opportunities. - Revenue forecasting and performance tracking
Enables leadership to monitor forecast accuracy, compare expected versus actual performance, and adjust strategies based on reliable data. - Sales activity monitoring
Tracks seller engagement across calls, meetings, and follow-ups, offering insight into the actions driving pipeline movement. - KPI tracking across teams
Standardizes performance metrics across regions, teams, and roles, ensuring alignment on targets and accountability. - Integration with analytics tools
Extends dashboard capabilities through tools like Power BI, allowing for deeper analysis, custom reporting, and cross-system insights.
In practice, the value of the dashboard depends on how well these capabilities are aligned with the organization’s sales processes and decision-making needs.
Why Most D365 Sales Dashboard Implementations Underperform
Organizations continue to invest heavily in CRM platforms, yet the expected impact on sales performance is often not realized. At the same time, buyer behavior is shifting. Research from Gartner shows that 67% of buyers prefer a rep-free experience, relying on digital interactions and self-service access to information throughout the buying journey.
This places greater pressure on sales teams to operate with accurate data, clear visibility, and consistent execution. However, in many organizations, the D365 Sales dashboard does not function as a reliable decision-making tool, creating a gap between available insights and actual sales performance.
Misaligned Metrics
Dashboards often track activity rather than outcomes. Metrics like calls made or emails sent are visible, but they are not always tied to pipeline progression or revenue impact.
Fragmented Data
Sales data frequently exists across multiple systems, including CRM, ERP, and marketing platforms. Without proper integration, the dashboard reflects only a partial view of the pipeline, limiting its effectiveness.
Low Adoption
Even well-designed dashboards fail when they are not embedded into daily workflows. When teams do not rely on the dashboard as a source of truth, data quality and decision-making become inconsistent.
Overloaded Interfaces
Too many KPIs without clear prioritization make dashboards difficult to interpret. Instead of enabling faster decisions, they introduce noise and slow down action.
AI Without Context
AI and Copilot capabilities are often enabled, but not operationalized. Without aligning these features to real sales workflows, they remain underused and fail to deliver measurable impact.
What High-Performing Sales Teams Do Differently
With CRM investments exceeding $73 billion globally according to Grand View Research, most organizations already have access to the tools needed to manage pipeline and performance. The difference is not in the technology, but in how it is used.
High-performing sales teams treat the D365 Sales dashboard as an operational system, not just a reporting layer. It becomes part of how decisions are made, how performance is tracked, and how teams stay aligned.
Key patterns consistently emerge:
- Dashboards aligned to sales stages
Metrics are structured around the actual sales process, making it easier to track deal progression and identify where opportunities stall. - Real-time pipeline monitoring
Teams rely on up-to-date data to assess pipeline health, rather than periodic reports or manual updates. - Clear deal risk signals
Early indicators highlight at-risk opportunities, allowing teams to intervene before deals are lost. - Alignment across sales, finance, and leadership
Forecasting and performance metrics are consistent across functions, reducing discrepancies and improving planning accuracy. - Consistent usage across teams
The dashboard is embedded into daily workflows, ensuring that both sellers and leadership rely on the same source of truth.
In these environments, the dashboard moves beyond visibility and begins to actively support execution, enabling teams to respond faster, prioritize effectively, and maintain control over pipeline performance.
How AI and Copilot Enhance the D365 Sales Dashboard
AI and Copilot capabilities extend the value of the D365 Sales dashboard by shifting it from passive reporting to active decision support. Instead of requiring teams to interpret data manually, these capabilities help surface insights, automate routine tasks, and guide next steps within the sales process.
The impact is most visible when aligned to specific outcomes:
- Deal prioritization
AI helps identify high-value opportunities and flag deals that show early signs of risk. This allows sales teams to focus their efforts where it matters most, rather than relying on static pipeline views. - Activity automation
Routine updates, meeting summaries, and data entry tasks can be automated, reducing the manual effort required to maintain CRM records and improving data consistency. - Forecast support
Predictive insights based on historical trends and current pipeline behavior provide a more informed view of expected outcomes, helping leadership improve forecast reliability. - Next-best actions
Guided recommendations suggest follow-ups, engagement strategies, and timing based on deal context, enabling more consistent execution across teams. - Sales productivity
By reducing administrative overhead and surfacing relevant insights in context, sellers can spend more time on customer interactions and less time navigating systems.
When applied effectively, these capabilities do not replace sales processes. They strengthen them by embedding intelligence directly into how teams prioritize, act, and make decisions.
Power BI Integration Evolution: From Dashboard to System of Action
The role of the sales dashboard is shifting. It is no longer limited to reporting on what has already happened. In more mature environments, it becomes a system that supports real-time decision-making and execution.
This shift happens across three key dimensions:
- From reporting to decision-making
Instead of reviewing past performance, teams use the dashboard to assess pipeline health, identify risks, and determine where to focus next. - From static views to real-time visibility
Data is continuously updated and connected across systems, allowing teams to act on current information rather than outdated reports. - From insights to execution
Insights are no longer standalone. They trigger actions, guide follow-ups, and influence how opportunities are managed day to day.
This is where the integration of tools like Microsoft Fabric and Power BI becomes critical. Rather than operating as separate reporting layers, they provide a unified data foundation that connects CRM, ERP, and other business systems. This enables:
- alerts that trigger timely follow-ups on at-risk deals
- insights that directly inform next steps within the sales process
- dashboards that are embedded into daily workflows, not reviewed in isolation
In this model, the dashboard is not just a place to view performance. It becomes part of how sales teams operate, aligning data, insights, and actions into a single, continuous process.
Improve How Your Sales Team Uses the D365 Sales Dashboard
Many organizations have the right tools in place but struggle to translate them into consistent execution. Aligning your dashboard with revenue processes, integrating key data sources, and embedding it into daily workflows can significantly improve how your team manages pipeline and performance.
Request a ConsultationWhat to Look for in a D365 Sales Dashboard Implementation Partner
Selecting the right partner for a D365 Sales dashboard implementation comes down to more than setup. It determines whether the dashboard becomes a reporting tool or a system that supports real sales execution.
At a minimum, organizations should evaluate partners across five areas:
- Alignment with revenue processes
Dashboards should reflect how your sales teams manage pipeline, not just standard CRM metrics. - Integration across systems
The ability to connect CRM with ERP, marketing, and analytics platforms to ensure a complete and reliable view of data. - AI applied to real workflows
Experience using AI and Copilot for prioritization, forecasting, and activity automation, not just enabling features. - Adoption and usability
A focus on making dashboards usable in daily workflows, ensuring consistent usage across teams. - Governance and scalability
A structured approach to data quality, security, and long-term adaptability. - Understanding of licensing and feature dependencies
The partner should be able to guide which dashboard, AI, and analytics capabilities are included in standard licenses versus those that require additional configuration or add-ons, ensuring there are no gaps between expected and actual functionality.
The difference between implementation and customization is critical. Implementation gets the dashboard live. Customization ensures it reflects how your sales organization actually operates and evolves over time.
AlphaBOLD’s Approach to the D365 Sales Dashboard
At AlphaBOLD, the focus is not on deploying dashboards, but on ensuring they support how sales teams operate and make decisions.
Our approach is structured around a few key principles:
- Business-first design
Dashboards are aligned to revenue workflows, ensuring metrics reflect deal progression, pipeline health, and sales performance rather than generic activity tracking. - Unified data architecture
CRM, ERP, and analytics platforms are connected to provide a consistent and complete view of pipeline and performance across the organization. - AI with purpose
Copilot and automation capabilities are applied where they support prioritization, forecasting, and execution, rather than being enabled without clear use cases. - Adoption-focused delivery
Dashboards are designed to be used within daily workflows, helping ensure consistent adoption across sales teams and leadership. - Scalable framework
The solution is structured to evolve with the organization, supporting changes in processes, data, and business requirements over time.
The objective is to move beyond reporting and establish a system that supports visibility, alignment, and execution across the sales function.
Signs Your Current D365 Sales Dashboard Needs Improvement
In many cases, the limitations of a sales dashboard are not immediately visible. However, certain patterns consistently indicate that the current setup is not supporting effective decision-making or execution.
Common signs include:
- Inconsistent forecasts
Different stakeholders report varying pipeline numbers, making it difficult to rely on forecast accuracy. - Manual reporting still required
Sales teams continue to export data or build separate reports outside the dashboard to understand performance. - Low dashboard usage
Sellers and managers do not consistently rely on the dashboard in their day-to-day workflows. - Limited visibility into deal risks
At-risk opportunities are identified late, reducing the ability to intervene and recover deals. - Disconnected data sources
CRM data is not aligned with ERP, marketing, or analytics systems, resulting in incomplete or misleading insights.
When these issues are present, the dashboard is functioning as a reporting layer rather than a system that supports real-time sales execution.
You may also like: Copilot for Microsoft Dynamics 365 Sales– How AI Helps Reps Close Faster
How to Get More Value from Your D365 Sales Dashboard
Improving the effectiveness of a D365 Sales dashboard does not require more features. It requires a focused approach to how data is structured, surfaced, and used within daily sales operations.
Key steps include:
Prioritize outcome-driven KPIs
Focus on metrics tied to pipeline progression, deal velocity, and revenue outcomes rather than standalone activity metrics.
Simplify dashboard design
Reduce noise by limiting the number of KPIs and highlighting the metrics that directly influence decisions.
Integrate key data sources
Connect CRM with ERP, marketing, and analytics platforms to ensure a complete and consistent view of performance.
Embed AI into workflows
Apply AI and Copilot capabilities where they support prioritization, forecasting, and follow-up actions within the sales process.
Align usage across teams
Ensure that both sales teams and leadership rely on the same dashboard as a source of truth, reinforcing consistency in reporting and decision-making.
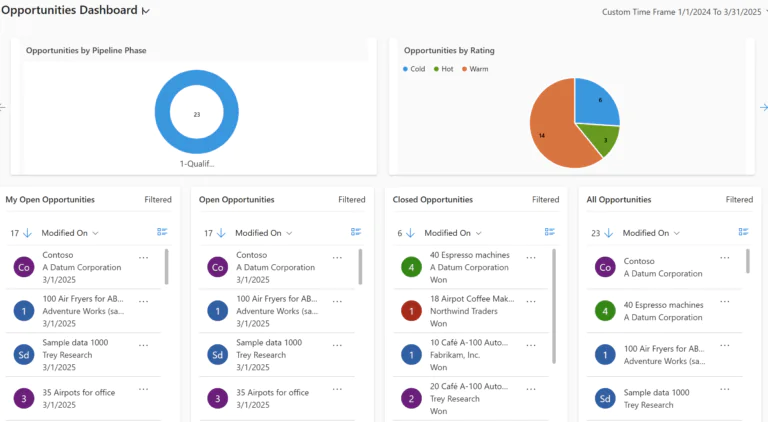
When these elements are in place, the dashboard becomes more than a reporting tool. It supports how sales teams prioritize, act, and manage performance on an ongoing basis.
Assess Your D365 Sales Dashboard Performance
If your current dashboard is not providing consistent visibility into pipeline health or supporting accurate forecasting, it may be time to reassess how it is structured and used. Identifying gaps in data alignment, adoption, and workflow integration is often the first step toward improving sales performance.
Request a ConsultationConclusion
A D365 Sales dashboard on its own does not improve performance. Its impact depends on how well it is aligned with sales processes, data flows, and day-to-day execution.
When dashboards are designed around how teams actually manage pipeline and make decisions, they provide consistent visibility, more reliable forecasts, and earlier identification of deal risks.
AlphaBOLD works with organizations to ensure the dashboard becomes part of how sales teams operate, not just a tool for reviewing results.
FAQs
Look for teams with repetitive, measurable workflows and a mix of early adopters and cautious users. Pilots should balance risk with the potential to demonstrate clear value and gather actionable insights.
AI enhances the D365 Sales Dashboard by turning static data into actionable insights. Instead of manually analyzing reports, sales teams can rely on AI to identify at-risk deals, prioritize high-value opportunities, and recommend next steps.
It also supports forecasting by analyzing historical patterns and current pipeline behavior, improving accuracy over time. When implemented correctly, AI reduces manual effort and helps sales teams focus on decision-making rather than data interpretation.
Sales dashboards are often underutilized because they are built for reporting, not for daily decision-making. Many organizations track too many metrics without aligning them to actual sales workflows, which makes dashboards difficult to use and easy to ignore.
Another common issue is disconnected data. When CRM, ERP, and marketing systems are not aligned, the D365 Sales Dashboard lacks the context needed to provide meaningful insights. As a result, teams fall back on manual reporting or gut-based decisions.
Improving adoption starts with aligning the D365 Sales Dashboard to how sales teams actually work. This means focusing on a small set of high-impact KPIs, organizing dashboards around sales stages, and ensuring the data reflects real-time activity.
Adoption also improves when dashboards are embedded into daily workflows, not treated as standalone reporting tools. When sellers and managers rely on the dashboard for pipeline reviews, forecasting, and deal prioritization, usage becomes consistent and valuable.
When evaluating a Dynamics 365 partner, organizations should look beyond technical implementation and focus on business alignment. A strong partner understands sales operations, not just CRM configuration, and can design the D365 Sales Dashboard around revenue workflows and decision-making needs.
It is also important to assess their ability to integrate data across systems, enable AI capabilities in a practical way, and drive user adoption. The right partner ensures the dashboard is not only implemented correctly but also delivers measurable impact over time.
Getting measurable ROI from a D365 Sales Dashboard depends on how well it is aligned with revenue-driving activities, not just how it is configured. Organizations see the most value when dashboards are designed to improve forecasting accuracy, highlight deal risks early, and reduce time spent on manual reporting.
This requires clean, connected data across CRM and other business systems, as well as clear KPI definitions tied to sales stages and outcomes. AI capabilities can further improve ROI by identifying patterns, prioritizing opportunities, and guiding seller actions, but only when they are embedded into daily workflows.
In practice, ROI is realized when the D365 Sales Dashboard becomes a core part of how sales teams review pipeline, make decisions, and track performance, rather than a static reporting layer used occasionally.
Explore Recent Blog Posts