
How to Forecast Construction Sales Using Historical Project Data

Table of Contents
Introduction
If August is your highest-revenue month, does that mean August is your best month for sales? Not necessarily. The projects generating August revenue may have entered your pipeline in February, been quoted in March, and closed in May.
That distinction is exactly why construction sales forecasting requires more than looking at last year’s revenue totals. By analyzing historical bids, opportunities, project types, win rates, sales cycles, and seasonal patterns alongside today’s pipeline, construction leaders can get a clearer picture of what is likely to close, when it may close, and where their sales teams should focus next.
What Is Construction Sales Forecasting?
Construction sales forecasting estimates the amount of new business a construction company is likely to win over a defined period.
A useful forecast does not simply add up every open opportunity. It considers factors such as:
- Historical win rates
- Current opportunity stage
- Expected close dates
- Average sales-cycle length
- Project and customer type
- Contract value
- Seasonal sales patterns
- Previous close-date slippage
For example, a $10 million pipeline does not necessarily represent $10 million in future sales. Some opportunities will be lost, others will move into the next quarter, and certain project categories may historically convert much more frequently than others.
This is where historical data becomes useful.
McKinsey’s 2026 analysis of the AEC industry estimates that AI and automation technologies could generate approximately $228 billion in annual value for the U.S. AEC industry by 2030. The research also identifies proprietary project data and the ability to create learning loops from previous projects as potential sources of competitive advantage. For construction sales teams, the same principle applies: past outcomes can help inform better decisions about current opportunities.
What Historical Data Should Construction Companies Analyze?
You do not need every data point your business has ever collected. Start with information that helps explain what was sold, how it was sold, and what eventually happened.
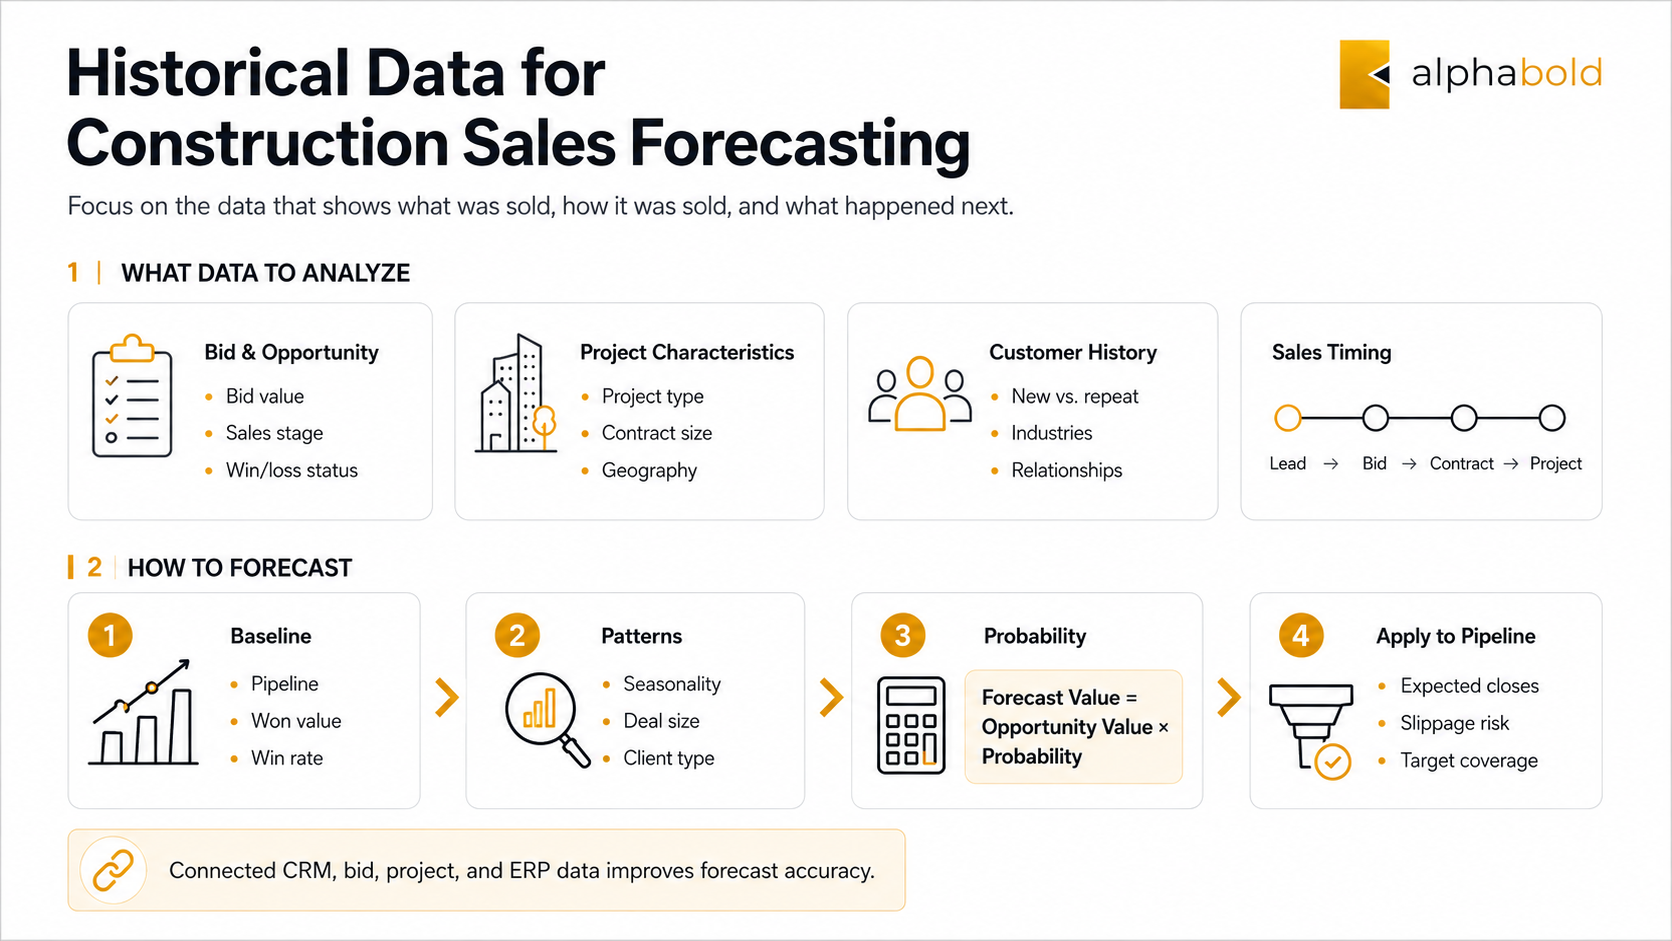
Bid and Opportunity Data:
Look at:
- Bid value
- Proposal date
- Sales stage
- Expected close date
- Actual close date
- Won/lost status
- Reason for loss
This helps establish historical conversion rates and shows where opportunities commonly stall or slip.
Project Characteristics:
Segment previous wins and losses by:
- Project type
- Contract size
- Geography
- Service line
- Delivery model
A company-wide win rate can hide meaningful differences. Your business might win 45% of repeat-client renovation opportunities but only 15% of large first-time commercial bids.
Those opportunities should not carry the same forecast probability.
Customer History:
Compare new and repeat customers, industries, account sizes, and previous relationships.
Repeat business may behave very differently from new-client acquisition, particularly in relationship-driven construction markets.
Sales Timing:
Track when:
Lead generated → Bid submitted → Contract signed → Project started
This is especially important when identifying seasonality.
Your busiest project month may not be your strongest sales month.
Connected technology for AEC companies can make these relationships easier to analyze across the sales and project lifecycle. Solutions such as BUILDFitters can also bring opportunity management, bids, estimates, project information, and construction-specific workflows into a more connected environment.
How Do You Forecast Construction Sales From Historical Data?
A practical construction sales forecast can be built in five steps.
1. Establish Your Baseline:
Start with at least several quarters of reliable historical opportunity data.
Calculate:
- Total pipeline generated
- Total value won
- Win rate
- Average deal size
- Average time to close
- Percentage of opportunities that missed their expected close date
Then segment those results by factors such as project type, region, client type, and contract size.
The objective is to establish what normal performance actually looks like for your business.
2. Identify the Patterns That Matter:
Next, determine what characteristics consistently affect outcomes.
You may discover that:
- Repeat clients convert significantly more often than new accounts.
- Projects under $2 million close faster than larger contracts.
- One service line consistently outperforms another.
- Opportunities created during certain months have higher close rates.
- Particular deal types frequently slip into the following quarter.
These insights are more useful than an organization-wide average because they provide context for current opportunities.
3. Assign Evidence-Based Probabilities:
Historical performance can then provide a baseline probability for similar opportunities in today’s pipeline.
A simple weighted model is:
Forecast Value = Opportunity Value × Probability of Closing
For example:
A $1 million opportunity with a historically supported 60% probability contributes $600,000 to the weighted forecast.
This does not mean the company will receive $600,000. It allows multiple opportunities to be evaluated consistently rather than relying only on individual salesperson judgment.
4. Apply Historical Behavior to the Current Pipeline:
This is where historical analysis becomes construction pipeline forecasting.
Ask:
- How much pipeline is expected to close this month or quarter?
- How often have similar opportunities actually closed on schedule?
- Which deals have the greatest risk of slipping?
- Which project categories historically convert best?
- Do we have enough pipeline to reach our sales target after historical win rates are considered?
Platforms such as Dynamics 365 Sales can support opportunity management, forecasting, and sales visibility, while analytics tools can help leadership compare pipeline expectations with historical results.
If improving pipeline visibility is a priority, AlphaBOLD’s guide on leveraging Power BI dashboards for B2B sales explores how sales teams can use dashboards to monitor opportunities, performance, and pipeline trends in more detail.
Get More From the Construction Data You Already Have
Your company may already have the information required for better forecasting across its CRM, estimating platform, ERP, project systems, and spreadsheets. AlphaBOLD can help connect those sources and turn fragmented historical data into clearer sales and pipeline insights.
Request a Consultation5. Compare Your Forecast Against Actual Results:
Forecasting should be iterative.
At the end of every month or quarter, compare:
Forecast → Actual wins → Actual close dates
Then investigate the differences.
Did one category consistently underperform? Were close dates too optimistic? Did the market change? Were opportunities entering the wrong stages?
Over time, these adjustments make construction sales forecasting more responsive to how the business actually performs.
What Should a Construction Sales Forecast Dashboard Show?
A useful dashboard should answer business questions rather than simply display historical charts.
Construction leaders should be able to see:
- Expected sales by month and quarter
- Weighted pipeline value
- Forecast versus target
- Historical versus current win rates
- Opportunities likely to slip
- Pipeline coverage by service line
- Win rates by project type
- Average sales-cycle length
- Seasonal patterns in leads, bids, and wins
Power BI for construction can provide the analytics and visualization layer for this information.
If this is an area your business is exploring, AlphaBOLD’s article on Power BI for construction management takes a deeper look at how construction firms can consolidate project data and use Power BI to improve reporting and decision-making.
But the dashboard is only as reliable as the information behind it.
If sales data sits in a CRM, estimates live in spreadsheets, historical projects sit in an ERP, and project information resides elsewhere, the first challenge is often integrating multiple data sources in Power BI.
For businesses with larger or more fragmented data environments, Microsoft Fabric can provide a broader data foundation for analytics and AI.
When Should a Construction Company Invest in Forecasting Technology?
A spreadsheet can still work for a small company with a limited number of active opportunities.
Technology becomes increasingly valuable when:
- Multiple salespeople maintain separate forecasts.
- Pipeline reports require manual spreadsheet consolidation.
- Sales stages are inconsistent.
- Expected close dates repeatedly change.
- Leadership cannot easily compare forecast versus actual.
- Historical bid information is difficult to retrieve.
- Sales, estimating, finance, and project teams rely on different datasets.
At that point, the challenge is no longer creating another forecast spreadsheet. It is building a repeatable process around reliable data.
Depending on the environment, that may mean connecting CRM, ERP, project, and analytics tools. For construction companies already using or considering Microsoft ERP technology, AlphaBOLD’s guide to how construction firms can use Dynamics 365 Business Central and Copilot provides additional context on connecting project financials, operational data, and AI-assisted insights.
Build a Forecast Your Leadership Team Can Trust
AlphaBOLD can help construction companies connect sales, bid, project, and financial data and develop analytics environments that provide clearer visibility into pipeline performance, sales trends, and expected outcomes.
Request a ConsultationConclusion: Make Historical Data Part of the Next Sales Decision
Most construction businesses already know what they sold last year. Far fewer systematically use that history to decide what is likely to happen next.
That is the real value of construction sales forecasting.
By connecting historical bids, wins, losses, sales cycles, project characteristics, and current pipeline activity, construction leaders can move beyond a single pipeline number and start asking more useful questions:
Which opportunities are most likely to close? When should we expect them to close? Where are we most likely to win? And where should the sales team focus next? The better the historical data, the better those questions can be answered.
Frequently Asked Questions
Yes. Compare lead-generation dates, proposal dates, contract-signing dates, and project start dates separately. Recurring patterns can reveal when your strongest closing periods occur and how early sales activity needs to begin to support them.
Yes. Power BI can be used to analyze historical win rates, opportunity trends, seasonality, pipeline performance, and forecast-versus-actual results. Its effectiveness depends on having clean and sufficiently connected sales and project data.
No. Historical win rates, consistent sales stages, reliable close dates, and clean pipeline data can significantly improve forecasting without AI. AI and predictive models become more useful as the volume and quality of available historical data increase.
Explore Recent Blog Posts



Related Posts


