Table of Contents
Introduction
Power BI’s data integration capabilities have undergone a major transformation. With Microsoft Fabric, Direct Lake mode, and Dataflows Gen2 now mainstream, the way organizations connect, transform, and analyze data has fundamentally changed.
This guide covers everything C-level executives and BI leaders need to know, from current connector options to best practices and the latest platform shifts.
What Makes Power BI Data Integrations So Powerful in 2026?
Power BI has evolved from a standalone reporting tool into the analytics layer of Microsoft’s unified data platform, Microsoft Fabric. This shift means data integration is no longer just about plugging in a connector; it is about architecting a governed, scalable data ecosystem.
The platform now supports four primary data connectivity modes:
- Import Mode: Data is loaded into Power BI’s in-memory engine for maximum query speed. Best for datasets under a few GB with acceptable refresh latency.
- DirectQuery: Reports query the source system in real time. Ideal for large or frequently updated datasets where freshness is critical.
- Direct Lake (New): Reads Parquet files directly from OneLake without importing or duplicating data. Delivers Import-level speed with DirectQuery-level freshness at petabyte scale.
- Composite Models: Mix Import, DirectQuery, and Direct Lake within a single semantic model for optimal performance and flexibility.
Why This Matters for Executives
Direct Lake mode alone eliminates one of the most persistent pain points in enterprise BI: choosing between data freshness and query performance. Organizations running large-scale analytics on Fabric report up to 10x performance improvements over traditional DirectQuery.
What Data Sources Can You Connect to Power BI Today?
Power BI supports over 200 native connectors, and the landscape has grown significantly with Fabric integration. Here is a structured overview of the most strategically important source categories:
Databases and Data Warehouses
- Relational: SQL Server, Azure SQL, MySQL, PostgreSQL, Oracle, Snowflake, Amazon Redshift
- Analytical: Azure Synapse Analytics, Google BigQuery, Databricks
- Fabric-Native: Fabric Lakehouse, Fabric Warehouse, Fabric SQL Analytics Endpoint
Cloud and SaaS Applications
- Microsoft Stack: SharePoint, Dynamics 365, Dataverse, Teams, Exchange
- CRM and Marketing: Salesforce, HubSpot, Marketo
- Analytics: Google Analytics 4, Adobe Analytics
- Finance and ERP: SAP, Oracle Financials, NetSuite
Files and Unstructured Sources
- Excel, CSV, XML, JSON, Parquet
- SharePoint folders and OneDrive
- Azure Blob Storage and Azure Data Lake Storage Gen2
Real-Time and Streaming Sources
- Azure Event Hubs and IoT Hub
- Fabric Eventstreams (native streaming pipeline into Power BI)
- PubNub and other streaming APIs
Custom and API Sources
- Web APIs via the built-in Web connector
- Custom connectors built with Power Query M
- OData feeds and ODBC/OLEDB drivers
Benefits of Power BI Integrations:
- Holistic Business View: Integrating various data sources allows for a more comprehensive understanding of the business, essential for strategic planning.
- Timely Insights: The capability for real-time analysis is crucial for dynamic business environments where rapid decision-making is key.
- Customization and Flexibility: Power BI enables tailored reports and dashboards to meet specific strategic needs.
- Ease of Use: Its intuitive interface allows executives to grasp key insights without deep technical expertise.
How Has Microsoft Fabric Changed Power BI Data Integration?
Microsoft Fabric, now generally available, is the most significant architectural change to the Power BI ecosystem since its launch. It unifies data lakes, data warehouses, data engineering, and analytics into a single platform built on OneLake, Microsoft’s multi-cloud data lake.
For Power BI users, the practical implications are substantial:
Direct Lake:
Direct Lake reads Delta Parquet files stored in OneLake directly into memory, bypassing the traditional import/refresh cycle. This means:
- No scheduled data refreshes for Fabric-native data
- Near-real-time data freshness by default
- Petabyte-scale analytics without the performance penalty of DirectQuery
- Single copy of data in OneLake, eliminating duplication
Dataflows Gen2:
Dataflows Gen2 replaces and significantly improves the original Power BI Dataflows. Key upgrades include:
- Output destinations: Write transformed data directly to Fabric Lakehouse, Warehouse, or Azure SQL
- Shorter authoring cycles with incremental refresh and staging
- 200+ connectors, including full support for enterprise sources
- Integration with Fabric’s compute engine for large-scale transformations
OneLake:
Every Fabric workspace gets OneLake as the underlying storage layer. Power BI semantic models connect directly to OneLake, so all downstream reports and dashboards automatically benefit from the latest data without additional pipeline steps.
What Are the Best Practices for Integrating Multiple Data Sources in Power BI?
Connecting data is the easy part. The harder challenge is building an integration architecture that stays performant, governed, and maintainable as your organization scales. Here are the practices that separate effective enterprise BI from fragile, ad-hoc builds:
Design Your Data Model Before You Connect:
The most common cause of slow Power BI reports is a poorly structured data model, not a lack of data. Before connecting sources:
- Identify the grain of each dataset and how they relate
- Use a star schema (fact tables + dimension tables) rather than flat, wide tables
- Implement a medallion architecture in Fabric: Bronze (raw) → Silver (cleansed) → Gold (analytics-ready)
Use the Right Connectivity Mode for Each Source:
Mixing connectivity modes in Composite Models is a powerful pattern, but requires deliberate planning:
- Use Import for small, stable reference datasets (product catalogs, data tables, lookup tables)
- Use DirectQuery for operational systems where freshness is non-negotiable.
- Use Direct Lake for all large Fabric-native datasets; it is the default recommendation for Fabric workloads
Centralize Data Prep in Dataflows Gen2, Not Individual Reports:
A common anti-pattern is duplicating transformation logic across dozens of reports. Dataflows Gen2 allows you to define transformations once and reuse the output across multiple semantic models. This reduces maintenance overhead and ensures consistency.
Prepare Your Semantic Model for AI and Copilot:
With Copilot now generally available, the quality of AI-generated answers depends entirely on how well your semantic model is described:
- Add descriptions to every measure, column, and table
- Define hierarchies (Year > Quarter > Month) explicitly
- Use the ‘Prep for AI’ feature in Power BI to validate Copilot readiness
- Set organization-specific AI instructions for consistent terminology
Implement Security at the Data Layer, Not the Report Layer:
Row-level security (RLS) applied only at the report level is fragile. Best practice is to:
- Define RLS rules in the semantic model so they propagate to all downstream reports
- Leverage Fabric workspace permissions and OneLake role-based access control
- Use object-level security to hide sensitive measures from specific user groups
For more insights, read our blog: Microsoft’s Support for Power BI: What Can You Expect?
Enhance your Data Strategy with Advanced Power BI Techniques!
Step into the future of data analysis with AlphaBOLD’s comprehensive Power BI services. Let us help you explore cutting-edge integrations and analytical methods so you can improve your business insights!
Let's Talk to ExpertPower BI 2026: What's Coming Next
Key Deprecations and Changes:
- Office Online Server Retirement (December 2026): Organizations using Power BI Report Server to host Excel workbooks will need to transition to alternative solutions by late 2026.
- 32-Bit Build Deprecation: As of August 2025, only 64-bit Power BI Desktop receives updates and support, providing better performance, security, and feature compatibility.
- Bing Maps to Azure Maps Migration: Power BI is transitioning from Bing Maps to Azure Maps for all mapping visualizations, ensuring continued support and access to latest geospatial features.
Licensing Evolution:
Pricing Adjustments (Effective April 2025):
- Power BI Pro: $14/user/month (up from $10)
- Power BI Premium Per User: $24/user/month (up from $20)
What You’re Getting: These increases reflect substantial platform investments including Copilot capabilities, Fabric integration, enhanced performance, and new AI-driven features that significantly expand Power BI’s value proposition.
Strategic Recommendation: Organizations should audit current licensing, assess which users truly need Pro/PPU capabilities, and explore bundled options like Microsoft 365 E5 which includes Power BI Pro.
How to Integrate Multiple Data Sources in Power BI
Integrating multiple data sources in Power BI is more than a technical process; it’s a strategic step towards comprehensive business intelligence that empowers C-level executives with deeper insights. This guide, while technically detailed, is framed to underscore the strategic value of each step in the data integration process.
Step 1: Connect to Data
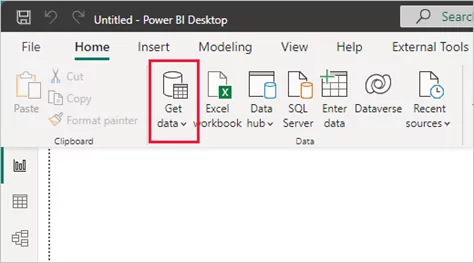
- Open Power BI Desktop: Start by opening the latest version of Power BI Desktop. For executives, staying updated with the latest version means leveraging the most advanced features for data analysis.
- Select Get Data: This is where the journey of transforming data into strategic insights begins. From the Home ribbon, click ‘Get Data’ to access a wide range of sources.
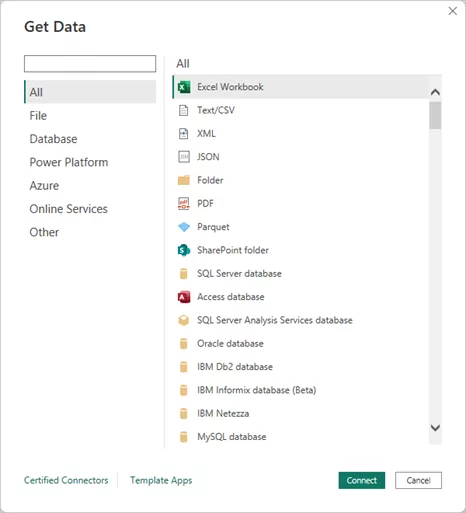
- Choose Your Data Source: For this example, we’ll use an Excel file. Select ‘Excel’ from the list of data sources in the ‘Get Data’ window and then click ‘Connect.’
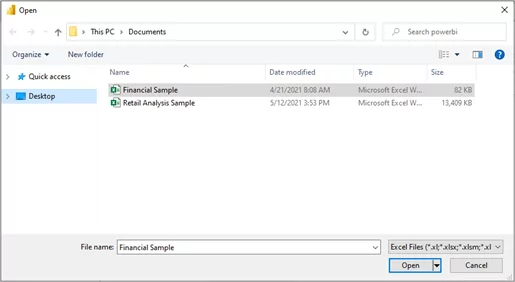
Step 2: Provide Data Source Location
- Locate Your Excel File: Navigate and connect to your Excel file (e.g., ‘Financial Sample’). This step signifies the integration of financial or operational data, foundational for strategic analysis.
You may also like: Power BI Executive Dashboards for Data-Driven Leadership
Step 3: Load Data Using Navigator
- Load Workbook Contents: Power BI Desktop will load the workbook and display its contents in the Navigator window. Here, you can select which data you wish to load into Power BI Desktop. Check the boxes next to the tables you want to import.
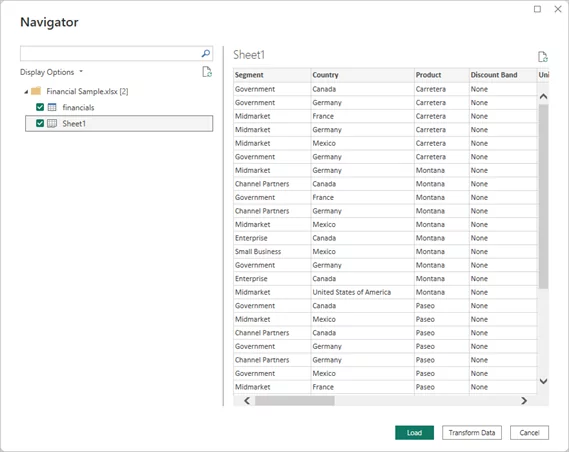
- Finalize Data Import: After selecting the desired tables, click ‘Load’ to import the data into Power BI Desktop.
Step 4: View Data in the Fields Pane
- Explore Your Data: The Fields pane gives a snapshot of the data now available for analysis. For a C-level executive, this is where data starts to transform into actionable insights.
Step 5: Repeat for Additional Data Sources
- Integrate More Data: To build a comprehensive data landscape, repeat these steps for additional sources like Salesforce or Azure Blob Storage. Each new source enriches the decision-making canvas.
Step 6: Combine and Analyze Data
- Create Reports: With the data integrated, the focus shifts to creating reports. For an executive, this means using Power BI’s data modeling features to draw connections between different data sets, ultimately crafting a narrative that informs strategic decisions.
Additional Resource:
- For a comprehensive guide on connecting to data in Power BI, visit Microsoft’s Power BI documentation.
How Do Real Organizations Achieve with Power BI Data Integration?
Walmart, operating approximately 10,500 stores globally with millions of daily transactions, faced a critical challenge: finance teams across business units were building siloed reports with inconsistent metrics. The company standardized on Power BI and built a semantic model library covering the full breadth of financial data.
Outcome: This solution provided easy access to comprehensive data for all levels, from executive leadership to individual analysts, enabling swift and powerful data analysis.
Quote from Micah Dail, Director, Finance Data & Analytics:
“With Microsoft Power BI, we’ve established a semantic model library covering massive amounts of financial data. It gives associates easy access to the full breadth and depth of Walmart data…and enables them to powerfully analyze the data in a very quick manner.”
Continue reading: Walmart Finance standardizes on Power BI for reporting and analytics.
Netronix Integration: Achieving Project Management Success with AlphaBOLD
Netronix Integration, a growing project-based business, struggled with fragmented KPI data spread across its ERP and operational systems. Working with AlphaBOLD, the company implemented BOLDSuite Analytics, a custom Power BI data platform that consolidated project management data into a single view.
Outcome: The adoption of this integrated data platform enabled Netronix to gain consolidated project management capabilities and improved visibility into key performance indicators, which is essential for staying competitive in the market.
What Advanced Data Integration Techniques Improve Power BI Performance?
Advanced Power BI data integration techniques help organizations combine, manage, and analyze data more effectively across systems. For business leaders, these capabilities improve reporting accuracy, support faster decision-making, and provide better visibility into operations, finance, and customer data.
1. Custom Data Connectors:
Custom Power BI data connectors allow executives to tap into unique, non-standard data sources, providing a competitive edge by leveraging proprietary data in decision-making. By using connectors developed with Power Query M language, businesses can extract specific insights that align with their unique strategic goal.
2. Dataflows for Complex ETL Processes:
Dataflows streamline the ETL process, ensuring that the data feeding into Power BI models is clean and organized, a vital factor for reliable executive reporting. This technique aids in preparing data more efficiently, crucial for time-sensitive decision-making at the executive level.
3. Real-Time Data Streaming:
Real-time data streaming is essential for dashboards that inform immediate strategic decisions, such as monitoring live operational metrics. It enables executives to respond quickly to real-time business events, a capability critical in today’s fast-paced business environment.
You may also like: Overcoming Power BI Integration Challenges in 2025
4. Integration with Azure Services:
Integrating with Azure services like SQL Data Warehouse expands Power BI’s capabilities, enabling large-scale, cloud-based analytics suitable for enterprise-level strategic needs. This offers executives a robust platform for handling vast amounts of data, which is essential for comprehensive business intelligence.
5. Advanced DAX Calculations:
Advanced DAX techniques enable deeper data analysis, allowing executives to derive nuanced insights critical for strategic planning and performance measurement. Tailored calculations and measures provide a customized view of data, supporting specific strategic objectives.
6. Using Python and R Scripts:
Incorporating Python and R for advanced analytics offers executives tools for predictive decision-making, risk assessment, and uncovering hidden trends. This brings the power of data science into Power BI, enabling sophisticated analyses like machine learning models directly within business reports.
How AlphaBOLD Helps You Modernize Power BI Data Integration?
AlphaBOLD is a specialized Power BI and Microsoft Fabric partner. Unlike generalist IT firms, our team focuses exclusively on data and analytics solutions, which means we have seen and solved the full range of integration challenges organizations encounter at every stage of the BI maturity curve.
- Simplify Complex Data Connections: We help businesses connect their data from multiple sources into Power BI without complications.
- Optimize Data Transformation: Our team ensures that your data is clean, accurate, and ready for insightful analysis, saving you time and resources.
- Create Custom Dashboards & Reports: We customize Power BI solutions that cater to your specific business needs, delivering actionable insights in real-time.
- Ongoing Support & Maintenance: We provide continuous support to keep your Power BI solution running smoothly and ensure it evolves with your business.
Interested in learning more? Contact us today to discuss how AlphaBOLD can help optimize your Power BI integrations.
Connect Your Enterprise Data Sources Without Creating Reporting Silos
Unify ERP, CRM, operational, and cloud data into a centralized Power BI reporting environment built for scale and visibility.
Talk to a Power BI ExpertConclusion
Power BI has become more than a reporting platform. With Microsoft Fabric, Direct Lake, Dataflows Gen2, and AI-powered analytics, organizations can now connect and analyze data across ERP systems, CRMs, cloud platforms, APIs, and real-time sources within a unified environment.
As reporting demands grow, businesses need scalable, well-governed data architectures that enable faster insights and better decision-making. A modern Power BI integration strategy helps reduce data silos, improve reporting accuracy, and prepare organizations for AI-driven analytics.
AlphaBOLD helps businesses build Power BI and Microsoft Fabric solutions designed for enterprise reporting, governance, and long-term scalability.
FAQS
Power BI supports hundreds of connectors, including SQL Server, Oracle, SAP, Salesforce, Dynamics 365, Snowflake, SharePoint, Azure services, Google Analytics, REST APIs, and Microsoft Fabric OneLake.
Direct Lake is a Microsoft Fabric capability that allows Power BI to query Delta Parquet data directly from OneLake without importing or duplicating data. It combines the speed of Import mode with near real-time data access.
DirectQuery sends queries back to the source system at runtime, which can affect performance depending on source latency. Direct Lake reads data directly from OneLake storage layers, offering faster performance for large analytical workloads.
Dataflows Gen2 are modern data preparation and transformation tools in Microsoft Fabric that support scalable ETL operations, reusable transformations, and centralized data preparation for Power BI reporting.
Yes. Power BI supports real-time analytics through streaming datasets, Fabric Eventstreams, Azure Stream Analytics, IoT integrations, and Direct Lake architecture.
Microsoft Fabric unifies data engineering, warehousing, lakehouses, semantic modeling, and BI reporting into a single ecosystem. This reduces data duplication and simplifies enterprise analytics architecture.
Explore Recent Blog Posts