Table of Contents
Introduction
For businesses, the ability to make decisions based on real-time insights can mean the difference between seizing or missing out on market opportunities. Traditional Business Intelligence (BI) tools have long relied on periodic data refreshes, which are suffice for many daily reports and dashboards. However, with the growing popularity of streaming data and the ever-increasing customer expectations of 24×7 engagement, mere data refreshing is no longer sufficient to meet user demands.
While Power BI, Microsoft’s dynamic BI and analytics tool, was not initially designed for real-time data handling, it has adapted to the changing business landscape. Power BI now offers two different options for creating real-time reports and dashboards to address the need for up-to-the-minute insights. These options are revolutionizing how businesses access and utilize data, enabling them to gain a competitive edge by making decisions based on what is happening right now rather than relying on past events and outdated information. This article will explore how Power BI enables real-time data visualization, leading to instant decision-making.

Unlock the Power of Data Visualization!
Are you ready to transform your business insights with real-time data visualizations in Power BI? AlphaBOLD is here to guide you through the process. Experience the full potential of Power BI and make informed decisions faster.
Request a DemoUnderstanding Power BI
Power BI is a comprehensive suite of software services, applications, and connectors that collaborate to transform disparate data sources into coherent, visually compelling, and interactive insights. Whether your data resides in an Excel spreadsheet or a combination of cloud-based and on-premises hybrid data warehouses, Power BI offers a seamless solution. It simplifies the process of connecting to your data sources, allowing you to visualize, explore, and highlight critical information effortlessly. What sets Power BI apart is its capability to facilitate data sharing with a select audience or across the entire organization, making insights accessible and actionable to anyone who needs them. It helps companies make data-driven decisions and facilitate easy implementation without requiring significant upfront expenses.
Interested in learning more about Power BI?
Role of Power BI in Decision-Making
The significance of live insights within Power BI is underscored by the rapidly evolving dynamics of today’s business landscape. This need is multifaceted and compelling. Firstly, live insights empower swift decision-making, offering a competitive edge by enabling businesses to respond promptly to shifting market trends and operational challenges. Moreover, it enhances customer experiences through personalized interactions and immediate issue resolution. It proves indispensable in sectors reliant on the Internet of Things (IoT) and sensor data while also optimizing operational efficiency and promoting a data-driven organizational culture. Additionally, real-time insights facilitate proactive issue resolution and continuous monitoring, catering to healthcare and emergency services sectors. In sum, the demand for live insights within Power BI reflects the pursuit of agility, competitiveness, and customer-centricity, positioning organizations to thrive amidst the accelerating pace of change.
Power BI offers two powerful solutions for obtaining live insights: real-time data visualization and data streaming.
Real-Time Data Visualization: Tracking Every Update
Real-time data visualization in Power BI enables you to create dynamic dashboards and reports that update in near real-time as new data arrives. This feature is particularly valuable when you need to monitor data continuously and require the most up-to-date information without manual refreshes. Real-time data visualization relies on techniques like DirectQuery or live connections to data sources that support real-time updates.
Read more: The Value of Consulting Expertise in Power BI Implementations
Use Cases for Real-Time Data Visualization:
- Stock market analysis and trading, where seconds matter.
- Website traffic monitoring to track user behavior as it happens.
- IoT device tracking to monitor sensor data in real-time.
Data Streaming: Leveraging High-Velocity Data Flows
Data streaming in Power BI is purpose-built for processing and visualizing data that streams at high velocity. It allows you to set up continuous data streams that feed into your Power BI dashboards and reports. Data streaming is ideal for rapid data arrival rates, such as IoT sensor data, social media feeds, or live event tracking.
Use Cases for Data Streaming:
- Monitoring IoT sensors for equipment status and anomalies.
- Analyzing social media trends and sentiments as they unfold.
- Tracking live events like sports scores or financial market updates.
- Selecting the Right Tool for Your Needs
Both real-time data visualization and data streaming empower users with live insights, but their suitability depends on your specific requirements. Real-time data visualization caters to scenarios where you want to update visualizations for particular data sources. In contrast, data streaming is tailored for continuous, high-velocity data ingestion and real-time monitoring.
Creating Real-Time Data Visualizations in Power BI
In essence, creating real-time data visualizations in Power BI is a journey that encompasses data preparation and transformation, interactive dashboard design, and seamless real-time data refresh. It empowers organizations to make informed decisions as events unfold, fostering a data-driven culture that thrives on agility and responsiveness. Whether you’re tracking live market data, monitoring IoT devices, or analyzing customer behavior, Power BI’s real-time data visualization capabilities place you firmly in the driver’s seat of data-driven success.
Data Preparation and Transformation:
The journey to real-time data visualization begins with data preparation and transformation. Power BI offers robust tools to clean, shape, and refine your data, whether your data resides in spreadsheets, databases, or cloud repositories. This critical step ensures that the information you’re working with is accurate, consistent, and ready for visualization. With Power BI’s intuitive data modeling capabilities, you can establish relationships between tables, define measures, and create calculated columns—all of which lay the foundation for insightful visualizations.
Building Interactive Dashboards:
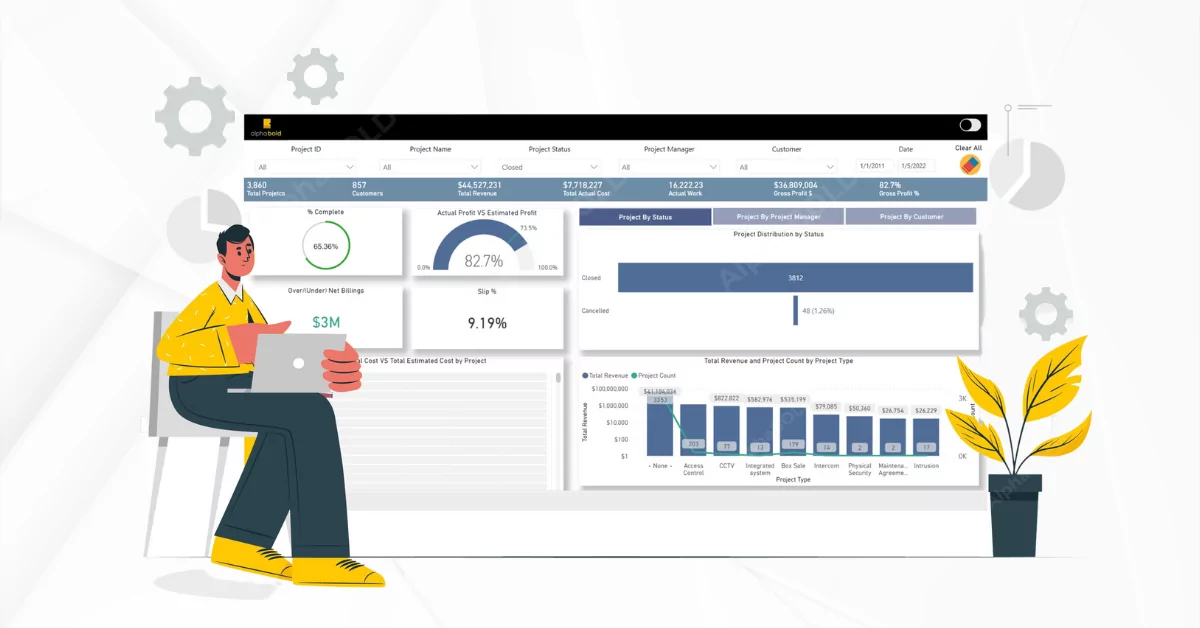
Once your data is primed, it’s time to build interactive dashboards. Power BI provides a rich array of visualization options, from basic charts and graphs to advanced custom visuals. You can arrange these visuals in a compelling layout to tell a data-driven story. Interactivity is a hallmark of Power BI dashboards, allowing users to drill down into data, apply filters, and ask ad-hoc questions. The result is a dynamic dashboard that adapts to user input, providing a deeper understanding of the data and enabling real-time exploration of insights.
Real-Time Data Refresh:
The true magic of real-time data visualization comes to life with the concept of data refresh. Power BI allows you to set up automated data refresh schedules, ensuring that your visuals always display the most current information. For real-time scenarios, Power BI offers various data connection options, such as DirectQuery and live connections, which enable data updates to be reflected in your visualizations without manual intervention. This real-time data refresh capability ensures that your insights remain relevant and actionable, even in fast-changing environments.
Read more: Advanced AI Analytics in Power BI for CTOs: Transforming Data Strategy
Micah Dail - Director, Finance Data & Analytics, Walmart
The flexibility in which a user can interact with their data in Power BI has proven to be a critical enabler of our finance transformation process.
Read the storySet up your real-time streaming dataset in Power BI
Setting up a real-time streaming dataset in Power BI involves creating a dataset that can continuously ingest and display data as it arrives. This process allows you to monitor and visualize high-velocity, real-time data. Here’s a step-by-step guide to setting up a real-time streaming dataset in Power BI:
- Sign into Power BI: Ensure you’re signed into your Power BI account.
- Access the Power BI Service: Go to the Power BI service by navigating to https://app.powerbi.com.
- Workspace Selection: Select the workspace where you want to create the real-time streaming dataset. You can either use an existing workspace or create a new one.
- Create a Streaming Dataset: In the selected workspace, click the “Create” button and select “Streaming dataset.”
- Choose Data Type: You will be prompted to select a data type for your streaming dataset. Power BI offers various data types such as “API,” “Streaming dataset,” “Push dataset,” and more. Choose “Streaming dataset.”
- Define Fields: Define the fields (columns) for your streaming dataset. These fields represent the data you’ll be streaming. Specify the field names and data types (e.g., Text, Number, DateTime) that match your data source.
- Create the Dataset: Click the “Create” button to create the streaming dataset.
- Obtain Push URL: After creating the dataset, you’ll receive a “Push URL.” This URL serves as the endpoint where you’ll send data to be ingested into the dataset. Keep this URL secure, as it allows external sources to push data to your dataset.
- Push Data to the Dataset: Use the Push URL to send data to the dataset. This can be done programmatically through scripts, APIs, or directly from data sources. Data should be formatted according to the schema you defined earlier.
- Monitor Data Ingestion: As you push data to the dataset, you can monitor the data ingestion process in real time. Power BI will update the dataset with the incoming data.
- Create Visualizations: Once data is flowing into the streaming dataset, you can create visualizations using Power BI Desktop or the Power BI web service. These visualizations will update in real-time as new data arrives.
- Share Real-Time Reports: Share your reports and dashboards with others in your organization or external stakeholders. They can access and view the real-time data through the Power BI service or mobile app.
Following these steps, you can set up a real-time streaming dataset in Power BI, enabling you to continuously monitor and visualize data as it arrives. This functionality is precious for scenarios where you need to stay up to date with rapidly changing data, such as IoT sensor readings, social media trends, or live event monitoring.
Read more on real-time streaming in Power BI here for more insights.
Conclusion
Power BI, with its robust real-time data visualization and streaming capabilities, empowers organizations to make informed decisions as events unfold. Whether you’re tracking live market data, monitoring IoT devices, or analyzing social media trends, Power BI is your gateway to staying ahead of the curve.
At AlphaBOLD, we understand the transformative potential of Power BI and its role in shaping a data-driven future. Our Power BI services are designed to help you unlock the full potential of this dynamic tool. From data preparation to visualization, real-time streaming to interactive dashboards, we offer comprehensive solutions catering to your unique needs.
Ready to supercharge your data analytics journey and gain a competitive edge?
Bridge the gap between data and decision-making!
Request a demoExplore Recent Blog Posts


