A Guide to Accessing and Editing Semantic Models with Power BI Tools

Table of Contents
Introduction
Power BI semantic models sit at the center of reporting, analytics, and business logic across the Microsoft ecosystem. They define how data is connected, calculated, secured, and consumed across reports and dashboards.
As Microsoft Fabric adoption grows, semantic models are becoming more than just reporting layers. They now support enterprise-scale analytics, Direct Lake architectures, centralized governance, and reusable business metrics across departments.
Microsoft also officially transitioned from the term “dataset” to “semantic model” in the Power BI Service. While many users still use both terms interchangeably, semantic models now represent a broader architectural layer that supports reporting consistency, AI-driven analysis, and scalable data management.
This guide explains how to access, edit, and manage Power BI semantic models using Power BI Desktop, the Power BI Service, XMLA endpoints, and Microsoft Fabric capabilities.
The Role of Semantic Model in Power BI
A Power BI semantic model is the analytical engine that sits between your raw data and your reports. It defines tables, relationships, measures, hierarchies, row-level security roles, and the storage mode used for each table. Everything a report does, every chart, every KPI card, every filter, is a query against the semantic model.
Microsoft formally renamed Power BI “datasets” to “semantic models” in November 2023. If you see the word dataset in older documentation or tutorials, it refers to the same object.
Why this matters: A well-designed semantic model is faster to query, easier to maintain, reusable across dozens of reports, and scalable to enterprise data volumes. A poorly designed one creates bottlenecks that no amount of report-level optimization can fix.
Why Semantic Model Design Determines Power BI Performance?
Before learning how, it is worth being direct about the stakes.

- Data Consistency: Every report and dashboard that shares a single semantic model gets one version of the truth. KPIs, time intelligence calculations, and filters are defined once at the model level and applied consistently everywhere.
- Query Performance: The VertiPaq in-memory engine aggressively compresses Import-mode data, enabling sub-second query responses even on large tables. Direct Lake extends this to lake-scale data without requiring an import copy.
- Self-Service Scalability: Pre-defined measures, clear naming conventions, and logical hierarchies let non-technical users explore data confidently without writing DAX or SQL.
- Governance and Security: Row-level security (RLS), object-level security (OLS), and sensitivity labels are all applied at the semantic model layer, ensuring access controls persist regardless of which report surface is used.
Choosing the Right Storage Mode
One of the most consequential decisions you make when designing a semantic model is the storage mode for each table. Power BI now supports three primary modes:
| Storage Mode | Data Held In | Best For | Fabric Needed? |
|---|---|---|---|
|
Import |
VertiPaq (in-memory) |
Static/slowly changing data |
No |
|
DirectQuery |
Source system |
Real-time operational data |
No |
|
Direct Lake |
OneLake Delta tables |
Large-scale Fabric lakehouses |
Yes (F/P SKU) |
You can mix modes within a single model (a composite model), for example, a large Direct Lake fact table combined with smaller Import dimension tables. This is now supported in public preview as of early 2026.
Part 1: Accessing and Editing Semantic Models in Power BI Desktop
Step 1: Open your Power BI Desktop File
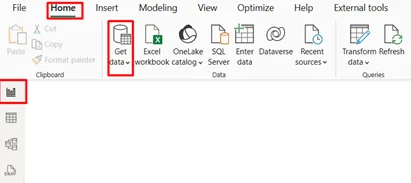
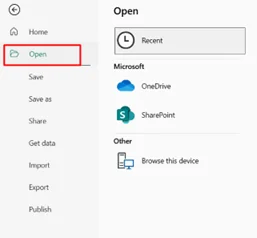
Power BI Desktop is the primary authoring environment for Import and DirectQuery semantic models. Open a .pbix file via File > Open, or start from scratch by connecting to a data source through Home > Get Data.
For Direct Lake models connected to Microsoft Fabric, see Part 3 of this guide. Direct Lake models are live-edited in the workspace rather than stored locally as .pbix files.
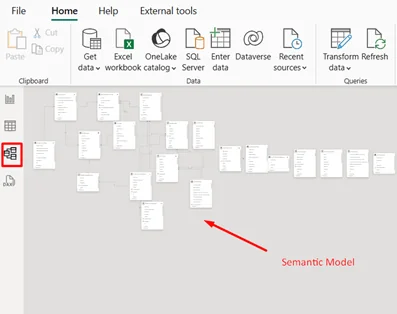
Step 2: Navigate to Model View
Click the Model icon (the diagram icon) in the left sidebar. This opens the Model view, which shows all tables as blocks and their relationships as connecting lines. This is your workspace for structural design.
- Tables are shown as cards. Expand them to see individual columns.
- Relationships show cardinality (one-to-many, many-to-many) and cross-filter direction.
- Hidden fields appear greyed out but remain queryable by measures.
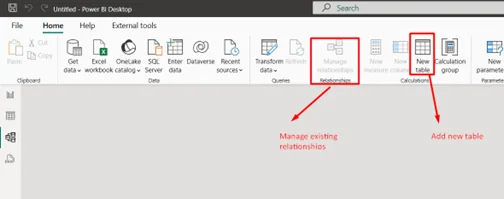
Step 3: Modify the Semantic Model
From the model view, you can make the following structural changes:
- Add Tables: Home > Get Data, then select your source. Power Query opens for transformation before the table is added to the model.
- Create Relationships: Drag a field from one table to a matching field in another. Power BI proposes a relationship type; you can customize cardinality and cross-filter direction.
- Add Measures: Measures are DAX expressions evaluated at query time. Go to the Modeling tab and select New Measure.
- Add Calculated Columns: Calculated columns are evaluated at refresh time and stored in the model. Use them sparingly; they increase model size. Prefer measures where possible.
- Add Hierarchies: Right-click a field and select Create hierarchy. Common examples: Year > Quarter > Month > Day for dates; Country > Region > City for geography.
- Manage Relationships: Go to Modeling > Manage Relationships to view, edit, or delete existing relationships in a table format.
Step 4: Build a DAX Measure (Practical Example)
Measures are the most powerful tool in the semantic model. Here is a basic example to get started:
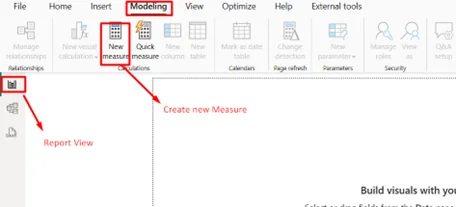
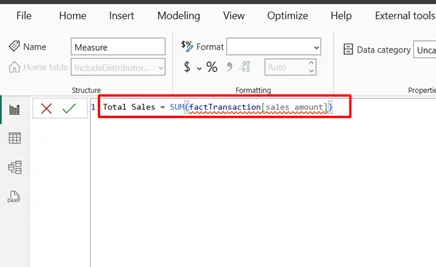
In the Report view, go to Modeling > New Measure.
Name the measure and write a DAX formula. For example:
Total Sales = SUM(factTransaction[SalesAmount])
Press Enter. The measure appears in the Data pane and can be used in any visual.
For more advanced patterns, such as time intelligence, running totals, or dynamic segmentation, DAX Studio (a free external tool) provides an IDE-like environment for writing and testing DAX expressions against your live model.
Step 5: Understand Power BI Desktop Limitations
Power BI Desktop is a single-user, local authoring environment. It does not support real-time co-authoring, scripted deployments, or certain advanced modeling features such as calculation groups, perspectives, and metadata translations. For these scenarios, use the XMLA endpoint with external tools (see Part 2).
Bonus Reading: Overcoming Power BI Integration Challenges in 2025
Part 2: Editing Semantic Models in Power BI service
What You Can and Cannot Edit in the Service?
The Power BI Service has significantly expanded its web-based modeling capabilities. However, it is still more limited than Desktop or XMLA-based tools for certain structural changes.
- You can edit measures, rename tables and columns, manage relationships, add row-level security, and configure refresh schedules directly in the browser.
- You cannot write Power Query transformations, add new data source connections, or use DAX Studio-level query diagnostics through the Service UI alone.
- For Import and DirectQuery models, select the semantic model in your workspace and choose Open data model to enter web modeling mode.
Step 1: Open a Semantic Model in the Service
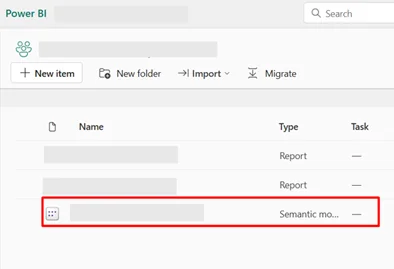
- Navigate to your Workspace in app.powerbi.com.
- Locate the semantic model. Semantic models are listed separately from reports in the workspace content list.
- Click the semantic model’s name to open its detail page or select the three-dot menu and choose Open data model.
Step 2: Using Web Modeling
Once in the web modeling view, you can:
- Add and edit measures using the DAX formula bar.
- View and modify relationships via the Model diagram.
- Configure display folders, column visibility, and data types.
- Add row-level security roles and test them with specific users.
Changes are saved automatically. The service maintains a version history so accidental changes can be rolled back.
Step 3: Refresh and Dataflow Integration
If your semantic model draws from Power BI Dataflows, navigate to Workspace > Dataflows and open the dataflow editor to modify Power Query transformations. Note that Dataflows handle data preparation, transforming raw source data before it reaches the semantic model. Structural semantic model changes (relationships, measures) are still made in the model itself, not the dataflow.
Part 3: XMLA Endpoint, Enterprise Editing with External Tools
What Is the XMLA Endpoint?
The XMLA (XML for Analysis) endpoint exposes your Power BI semantic model as an Analysis Services-compatible database that external tools can connect to over a standard protocol. Think of it as opening a direct, programmatic connection to the engine running your model.
This is the mechanism that tools like Tabular Editor, SQL Server Management Studio (SSMS), DAX Studio, and Excel’s Analyze in Excel all use to connect to a published semantic model.
On June 9, 2025, all Power BI and Fabric capacity SKUs support XMLA read/write operations by default. Previously, capacity administrators needed to manually enable write mode. This change removes that barrier for semantic model owners and co-authors.
What XMLA Enables That Desktop Does Not?
- Calculation groups: Reusable calculation logic that can apply to any measure in the model, essential for complex time-intelligence or currency conversion patterns.
- Metadata translations: Multi-language report and model support.
- Perspectives: Focused, role-specific views of the model that hide irrelevant tables and measures.
- Partition management: Fine-grained control over incremental refresh partitions, including updating historical partitions without reprocessing the entire table.
- CI/CD automation: Deploy and update semantic models across development, test, and production environments using TMSL scripts or Tabular Editor CLI, integrated into Azure DevOps or GitHub Actions pipelines.
- Diagnostics: Access Dynamic Management Views (DMVs) and SQL Server Profiler for performance tracing and bottleneck identification.
Supported External Tools:
- Tabular Editor 2/3: The most widely used tool for XMLA-based model development. Supports calculation groups, best practice analyzer, scripted deployments, and C# scripting. Tabular Editor 2 is open source and free.
- SQL Server Management Studio (SSMS): Requires version 18.9 or higher for read operations; 18.9+ for write/scripting. Supports DAX, MDX, and XMLA queries, and Tabular Model Scripting Language (TMSL) for model metadata scripting.
- DAX Studio: Focused on DAX query authoring, performance profiling, and server timing analysis. Connects to both Desktop (local XMLA) and Service (remote XMLA).
- Visual Studio with Analysis Services Projects (SSDT): Enterprise model authoring compatible with Power BI Premium workspaces. Requires an extension version 2.9.14 or higher and a compatibility level of 1500+.
- ALM Toolkit: Schema comparison and selective deployment, ideal for promoting specific changes from development to production without overwriting the entire model.
How to Connect via XMLA:
- Find your workspace connection URL: In the Power BI Service, open Workspace settings and copy the Workspace Connection string.
- Open your external tool (e.g., SSMS or Tabular Editor).
- In the connection dialog, paste the workspace connection URL as the server address.
- Authenticate with your Microsoft 365 credentials.
- The workspace appears as an Analysis Services server. Individual semantic models appear as databases.
Licensing note: XMLA read/write requires Power BI Premium Per User (PPU), Premium capacity (P SKU), or Fabric capacity (F SKU). Pro workspaces support read-only XMLA access only and do not support XMLA write operations.
Part 4: Microsoft Fabric and Direct Lake Semantic Models
What Changes Microsoft Fabric?
Microsoft Fabric introduces a unified analytics platform built on OneLake, a single, organization-wide data lake that uses Delta Lake as its storage format. For Power BI semantic models, Fabric brings a fundamentally new storage mode: Direct Lake.
Instead of importing data into the VertiPaq engine (Import mode) or querying the source at runtime (DirectQuery), Direct Lake loads data directly from Delta tables in OneLake into memory on demand. The result is Import-mode query performance on lake-scale data volumes, without the cost and latency of a full data refresh.
Direct Lake: Two Variants
- Direct Lake on OneLake (recommended): Reads directly from OneLake storage. Supports multi-source composite models, OneLake security, and all modern modeling features. Does not fall back to DirectQuery.
- Direct Lake on SQL: Uses the SQL analytics endpoint of a Lakehouse or Warehouse for schema discovery and security. Falls back to DirectQuery mode for SQL views or when granular SQL-level security is required.
Creating a Direct Lake Semantic Model:
Direct Lake semantic models are created in and live-edited from the Fabric workspace; there is no local .pbix file. All changes made in Power BI Desktop when connected to a Direct Lake model are applied to the workspace model immediately.
- Open Power BI Desktop and enable the preview feature: Create semantic models in Direct Lake storage mode from one or more Fabric artifacts (Options > Preview features).
- Go to the ribbon and select OneLake catalog.
- Choose a Lakehouse or Warehouse, and select the Delta tables you want to use.
- Give your semantic model a name, select a Fabric workspace, and choose the tables to include.
- The model is created in the workspace, and Power BI Desktop automatically enters live-editing mode.
You can also create Direct Lake semantic models directly in the Fabric web portal: from the Fabric portal, select Create > OneLake catalog, or open a Lakehouse and choose New semantic model from the ribbon.
Composite Models: Mixing Direct Lake and Import Tables
As of early 2026, composite semantic models combining Direct Lake tables with Import-mode tables from any data source are in public preview. This means you can:
- Use Direct Lake for large fact tables (billions of rows from OneLake).
- Use Import for smaller dimension tables that benefit from calculated columns or hierarchies unavailable in Direct Lake.
- Mix data from lakehouses, warehouses, SQL databases in Fabric, mirrored databases, and hundreds of external connectors through Power Query Online.
Direct Lake Model Development Best Practices:
- Use XMLA-compliant tools (SSMS 19.1+ or Tabular Editor) for advanced schema work and metadata inspection on Direct Lake models.
- Export to Power BI Project (PBIP) format for Git integration and CI/CD workflows. Note: PBIP exports metadata only, not the data itself.
- Use the version history in the Fabric workspace to roll back accidental changes. A snapshot is created automatically whenever a live-editing session starts.
- For enterprise development, each developer should work on their own private workspace copy of the model to avoid conflicts.
Part 5: Large Semantic Model Storage Format for Enterprise Scale
What Is the Large Semantic Model Storage Format?
By default, Power BI semantic models are stored in ABF format with a 1 GB size limit in the Service (10 GB upload limit from Desktop). For enterprise-scale analytical workloads with billions of rows, this is not enough.
The Large semantic model storage format (PremiumFiles) removes this ceiling. When enabled, the size limit is determined solely by the capacity’s capacity or the maximum configured by the capacity administrator.
Benefits Beyond Size:
Enabling a large semantic model storage format provides advantages even for models that are not yet large:
- XMLA write performance: Microsoft recommends enabling this setting for any model managed via XMLA write operations, regardless of model size, to improve XMLA write performance.
- On-demand load: Faster reloads of evicted models; models are removed from memory when capacity is needed for other workloads, and large format enables significantly faster reloads.
- Scalable growth: Models can grow incrementally through refreshes without hitting hard size ceilings.
How to Enable?
- In the Power BI Service, navigate to the semantic model settings.
- Expand the large semantic model storage format.
- Set the slider to On and select Apply.
- Trigger a refresh to load data under the new storage format.
Important: Once enabled, the large semantic model storage format cannot be reversed. Plan ahead before enabling it on production models. It is available on Fabric F SKUs, Premium P SKUs, Embedded A SKUs, and Power BI Premium Per User (PPU). Pro workspaces are limited to 1 GB regardless of this setting.
Licensing Requirements Summary:
Large semantic model storage format requires:
- Power BI Premium Per User (PPU), OR
- Power BI Premium capacity (P SKU), OR
- Microsoft Fabric capacity (F SKU), OR
- Power BI Embedded (A SKU)
Bonus Reading: Understanding Power BI Licensing
Struggling with Your Power BI Semantic Models?
Our data modeling experts will review your current setup, fix performance bottlenecks, and build scalable semantic models tailored to your business KPIs.
Optimize My Data ModelThe Best Practices of the Semantic Model Management
The best practices outlined below are necessary to ensure that semantic models are efficient, maintainable, and scalable.
- Star schema: Star schema (fact tables related to dimension tables) is frequently the most effective approach to laying out your information within a semantic design. It reduces redundancies and instead improves performance.
- Naming Conventions: Set a consistent naming standard between tables, columns, measures, and calculated fields; do not use idiosyncratic names. With this kind of naming standard, one can interpret the data model by the users, without confusion.
- Use of DAX: The language provides significant flexibility in constructing measures, but its application should be considered in the light of its effect on performance: complex DAX expressions often slow queries.
- Write about your Model: Annotations or external documentation can explain the intent of tables, relationships, and calculations. This will be useful in future maintenance or for new users who will be operating the model.
- Test Performance: You should frequently test the work of your semantic model as your data scales. Power BI enables you to optimize data models to run faster queries.
Did You Know?
Power BI’s Import Mode can compress data up to 10× in-memory and achieve an additional 20% reduction on disk, significantly optimizing performance and storage efficiency.
Partner with AlphaBOLD for Enterprise Power BI Adoption
Get expert help with Power BI dashboard management, implementation, and customization to experience robust reporting and in-depth visualization.
Request a DemoConclusion
FAQs
A semantic model is the structured layer in Power BI that organizes data for reporting and analysis. It contains tables, relationships, measures, hierarchies, and business logic that help users work with consistent and governed data across reports.
Yes. Microsoft officially renamed Power BI datasets to semantic models in the Power BI Service. The change reflects the broader role semantic models now play in Microsoft Fabric and enterprise analytics environments.
Yes, but editing capabilities in Power BI Service are limited compared to Power BI Desktop and external tools. The Service supports lightweight management tasks, while advanced modeling, relationship management, and optimization are typically handled in Desktop or through XMLA-compatible tools.
Direct Lake is a Microsoft Fabric storage mode that allows Power BI semantic models to query data directly from OneLake without traditional import refresh cycles. It is designed for large-scale analytics and Fabric-native reporting workloads.
XMLA endpoints allow external tools to connect to Power BI semantic models for advanced management and administration. Organizations commonly use XMLA endpoints with tools like Tabular Editor, SSMS, and ALM Toolkit for governance, deployment automation, and model optimization.
Large semantic models are useful when organizations manage high data volumes, enterprise-scale reporting, complex calculations, or incremental refresh workloads. These models are commonly used with Power BI Premium and Microsoft Fabric capacities.
Star schema is generally considered the preferred design approach for Power BI semantic models because it improves query performance, simplifies relationships, and supports scalable reporting environments.