
What are Out-of-Stock (OOS) Events?
Out-of-Stock (OOS) events, also referred to as stockouts, happen when a certain Stock Keeping Unit (SKU) is unavailable due to exhaustion of its inventory. Its frequency, or OOS rate, is commonly measured as the percentage of SKUs that are unavailable at a given time. OOS events cause loss of business and frustration for retailers, manufacturers, suppliers, and even customers. Though OOS events can occur at any point in supply chains, they are most common on the retail end. A study by NielsenIQ estimated that in the USA, the Consumer-Packaged Goods (CPG) industry lost out on 7.4% in sales due to stockouts in 2021 alone. This translates to lost revenue of $82 billion (NielsenIQ, 2021). Managing OOS events, therefore, is critical for the success of businesses, especially in the competitive CPG market. Before we have a look at how advanced analytics can help businesses prevent or reduce the possibility of stockouts, it is useful to understand the causes of stockouts.
Causes of OOS Events
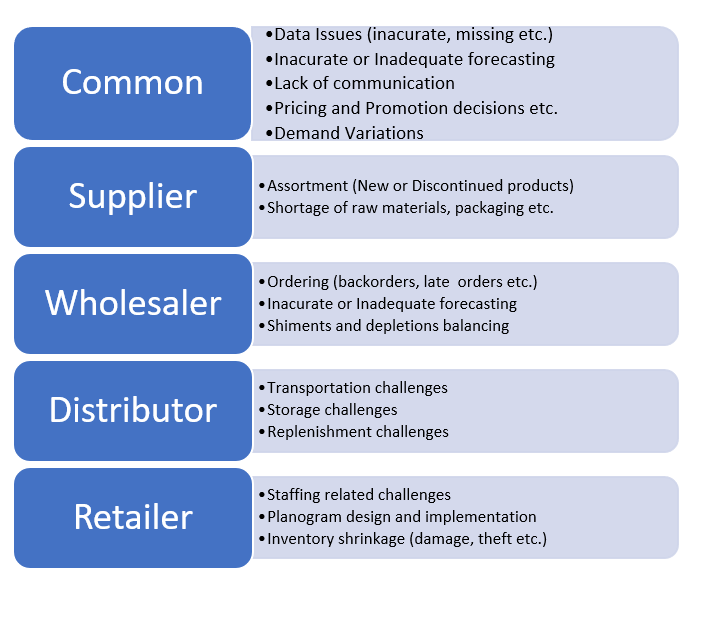
There are many causes of OOS events. Some of them can occur at any stage in the supply chain. In contrast, others are specific to each stage of the supply chain. The following visual provides a list of the most common causes of OOS events, both general and specific to different supply chain stages.
Preventing Out-of-Stock Events using Advanced Analytics
Demand Forecast using Artificial Intelligence
The first method is to use Machine Learning (ML)-based AI solutions to forecast future demand. This reduces the likelihood of OOS events through proactive inventory management and prescriptive analytics. These ML-based solutions can be deployed at any stage of the supply chain, based on the availability of data. They can even help learn insights and patterns using combinations of multiple data sources, provided data is integrated and not contained in silos. AI-based solutions also can integrate syndicated data to incorporate market-level information. An example of an AI-based sales forecasting solution can look like this:
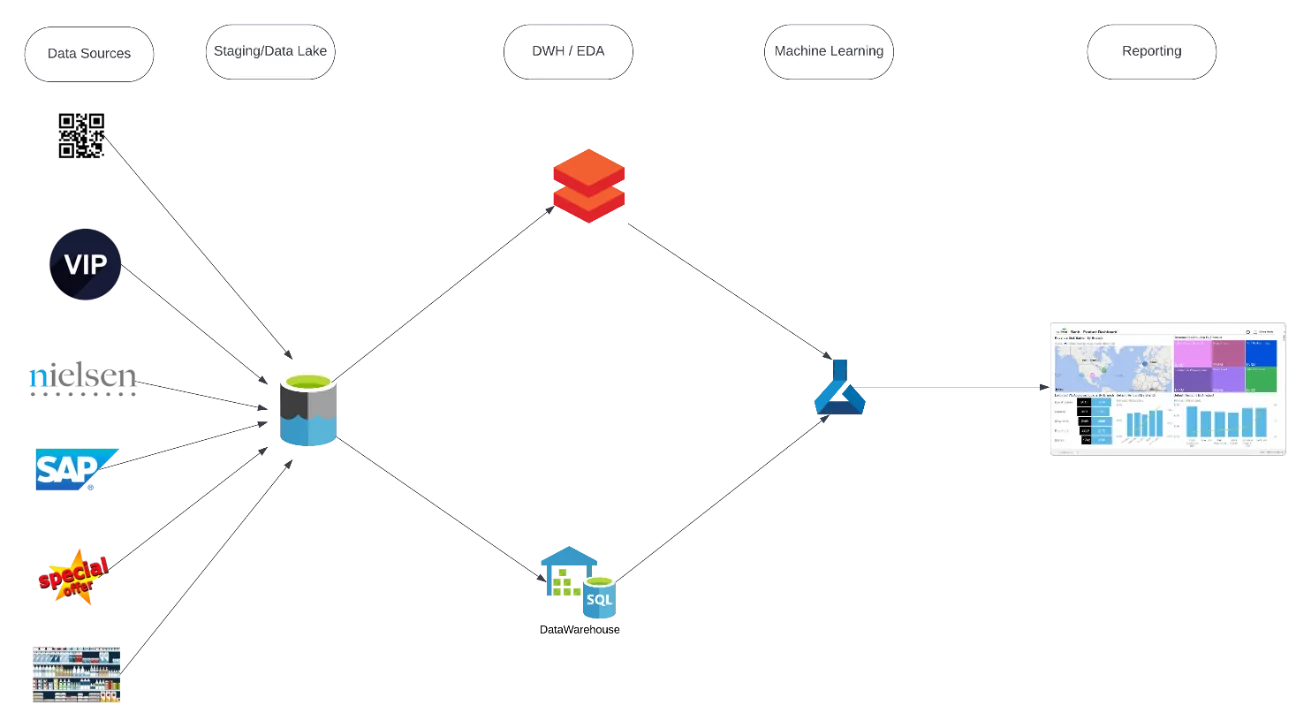
In the above scenario, we have multiple data sources that may include shipments, depletions, sales, promotions, market information, and other data that can be integrated and used to perform demand and supply analysis at various levels. However, such an AI-based solution can take time to mature and requires data governance and data-driven culture.
Statistical Methods using Time Intelligence
OOS events can also be predicted using time intelligence features and advanced analytical capabilities of reporting tools such as Power BI. For example, we can use sales data from the same period (week, month, quarter) last year and accommodate probable change by setting up what-if parameters to predict probable stockout scenarios.
In the following scenario, we have a simple line graph visualization that plots monthly sales of a specific SKU in green. Additionally, it has the Sales of the same SKU in the same period last year in red for comparison and future predictions. For example, for June 2021, we can see the current sales at $200k. The data point in the red line for the same month indicates sales of $238k. This can also be seen in the green line for June 2020.
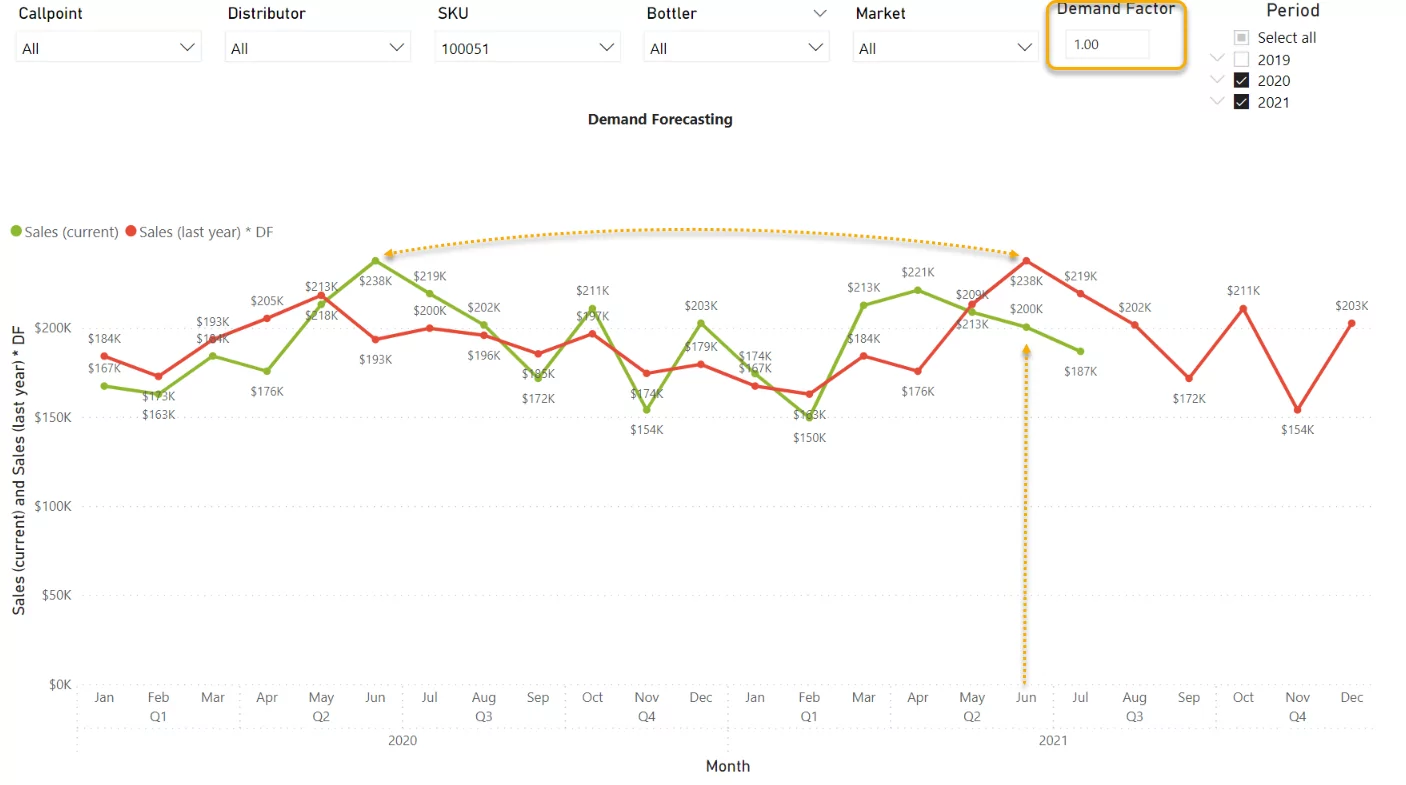
Looking at this, we can not only compare current and previous sales, but we can also expect the sales for the future. For example, in the same visual shown above, we can see from the red line that we can expect sales of $202k for our chosen SKU. We can further transform the expected sales calculation by various methods such as What-if parameters in Power BI. For example, what if the expected sales were 120% of the sales in the same month last year? We can provide a Demand Factor of 1.2 in the same report, and the Power BI will handle the rest as below:
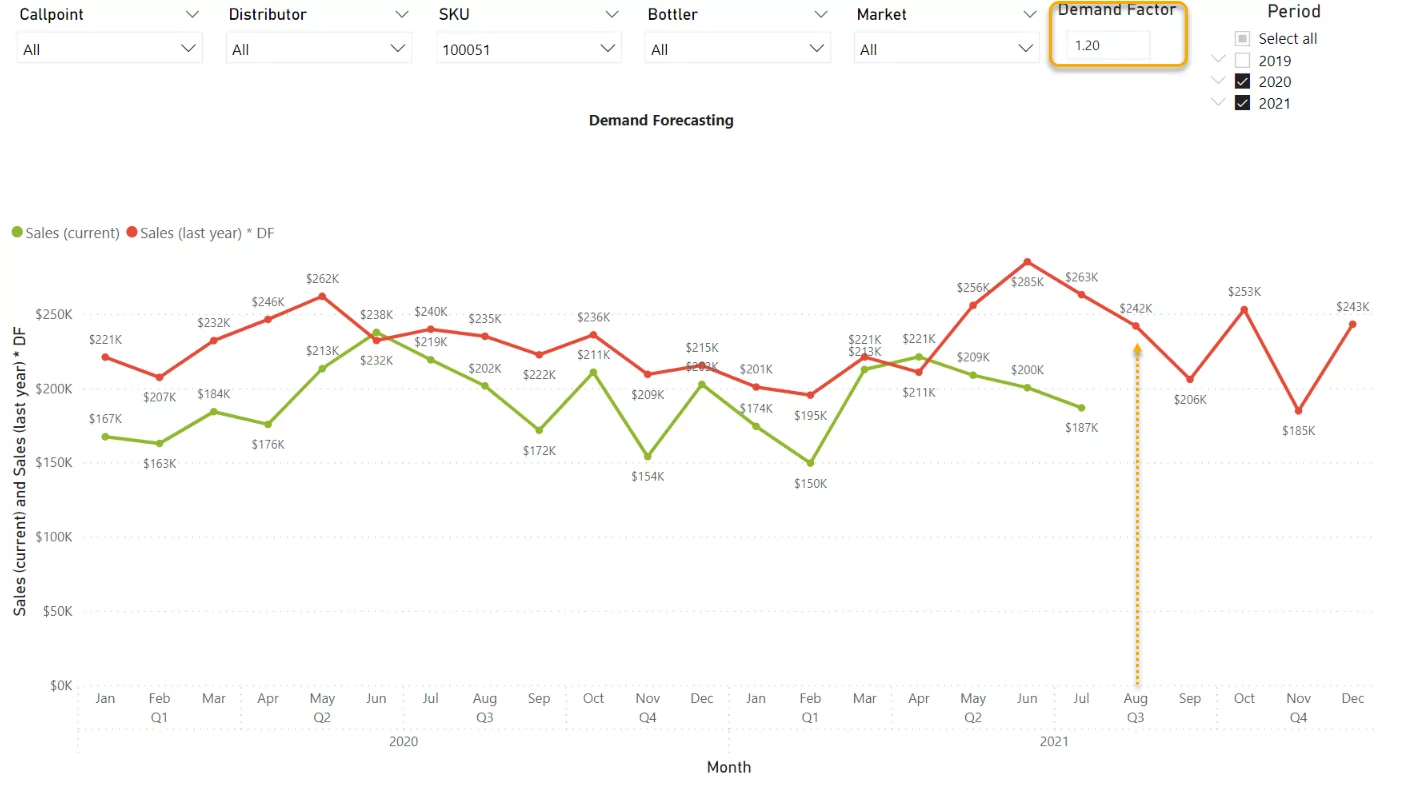
From the above, we can see that the expected sales are now $242k. This is one of the many ways we can forecast the demand and then adjust inventory to ensure safety stock bottom line.
Another method can be by comparing recent inflow and outflow. For example, we can look at depletions data and compare it with recent sales data to find cases where the depletion change is not proportional to the change in sales. In simpler words, if an SKU’s sales increase 50% in unit time, its depletion must improve with the same magnitude to keep up with the demand.
Similarly, we can compare shipments and depletions data using various KPIs to figure out the gap in the shipments and depletions. The analytical capabilities of Power BI also allow us to slice and dice the visuals and KPIs to the required granularity based on our use case.
Conclusion
Here, we have seen what stock-out events are, their causes and why it is important to prevent them. We have also seen common advanced analytics approaches to prevent stock-out events and ensure a successful business and happy customers.