Introduction:
Time Intelligence is one of the most important aspects of Power BI reporting. Good reporting practice utilizes minimalistic DAX expressions and avoids complexities to build the reports and analytics. Since Power BI is an advanced tool that caters to almost any kind of reporting need, it offers various time intelligence functions, some of which we will explore in this blog.
Time Intelligence plays a significant role in financial planning, budgeting, accounting, or any area which has to do with analytics based on time. Let’s get started.
Demonstration:
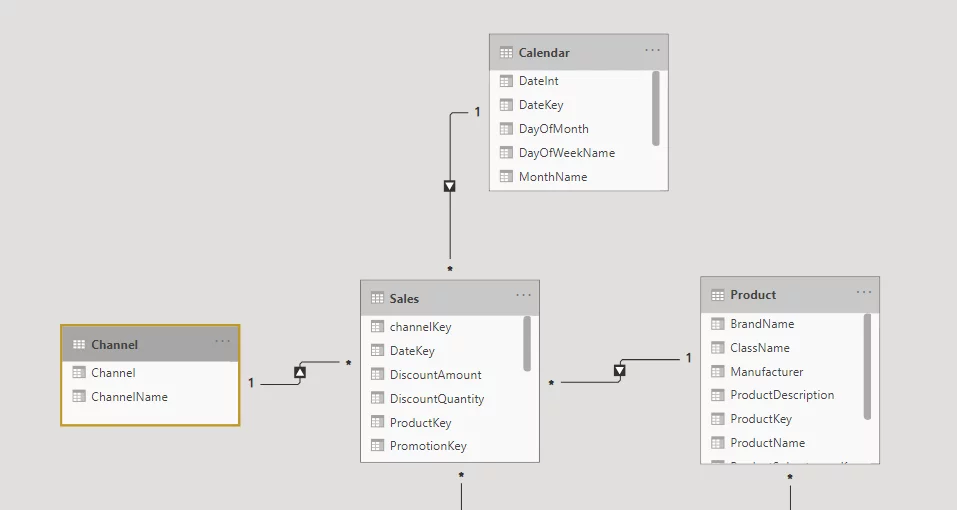
I have a demo Power BI model containing a Date Table (Calendar) which hasan active relationship with the Sales table.
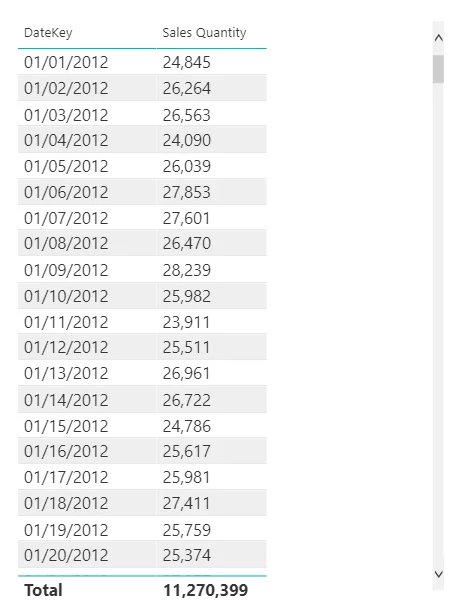
I have plotted a measure for Sales Quantity:
Let’s suppose we want to compare the current Sales Quantity with different timeframes from the Previous Year. Here is how we can do that:
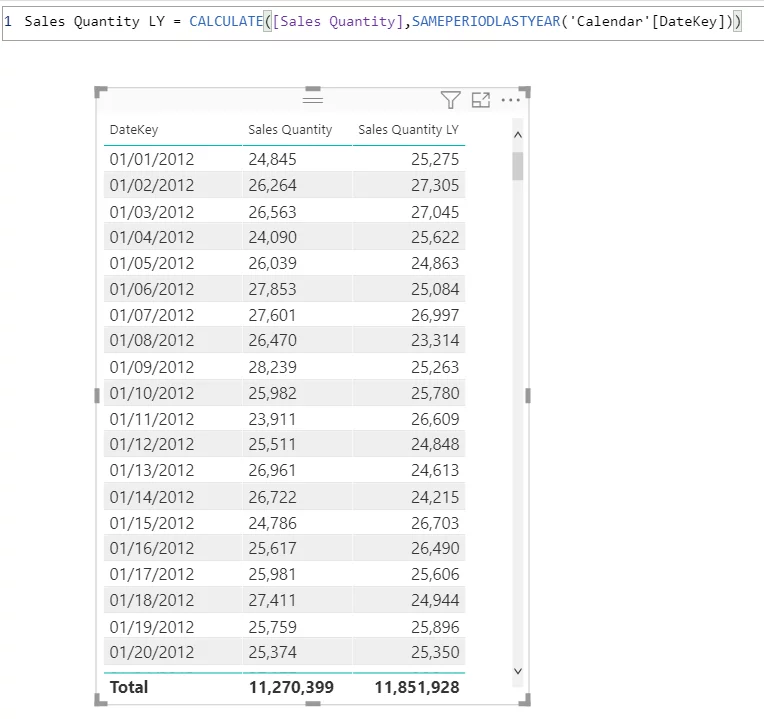
SAMEPERIODLASTYEAR():
Depending on the current date selection, this function automatically evaluates the DAX expression for the previous year’s date criteria.
For example, in the screenshot below, you can see that Sales Quantity LY plots the values for the previous year’s sales quantity i.e., 2011.
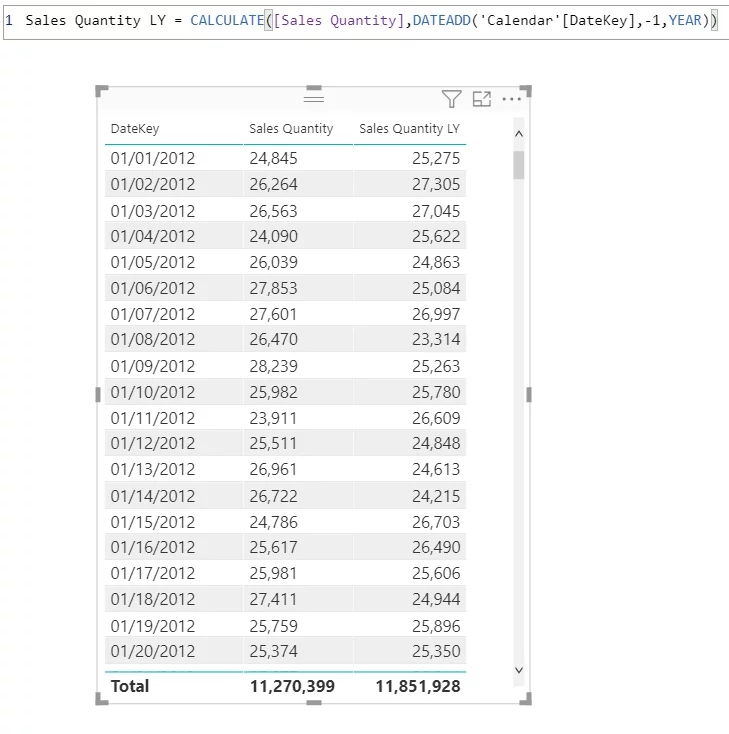
DATEADD():
We can also use the DATEADD() function, which provides more flexibility in timeline selection. Here are a few examples:
As an alternative to SAMEPERIODLASTYEAR(), I have used DATEADD() in the screenshot above. The results are the same.
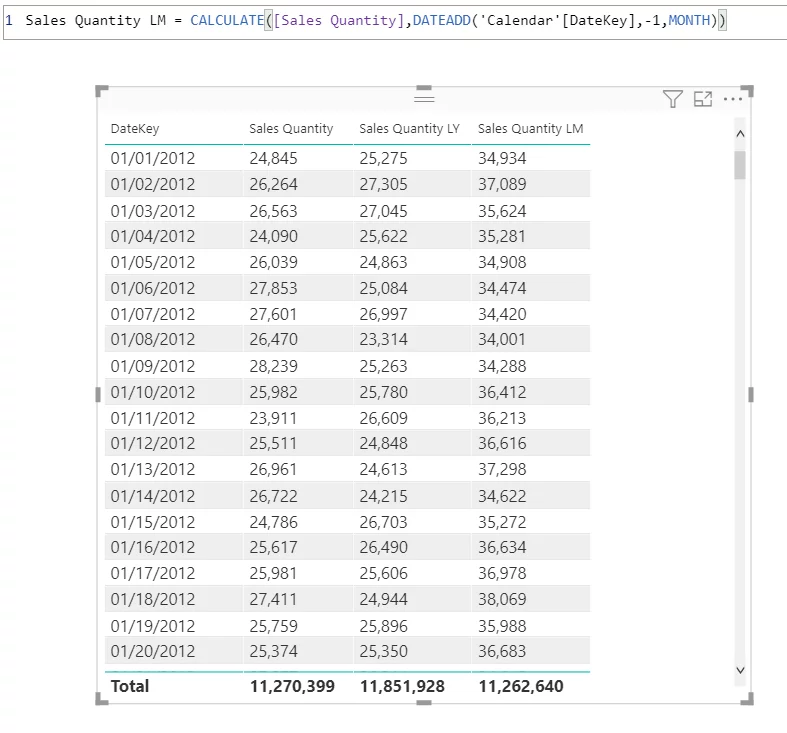
Similarly, if we want to check Sales Quantity for Previous Month, Quarter, or Day, we can do that as well just by tweaking the DATEADD() function quite easily. See the screenshot below for the Previous Month calculation.
Ready to connect with our Power BI consultants? Contact us!
DATESMTD(), DATESYTD(), DATESQTD():
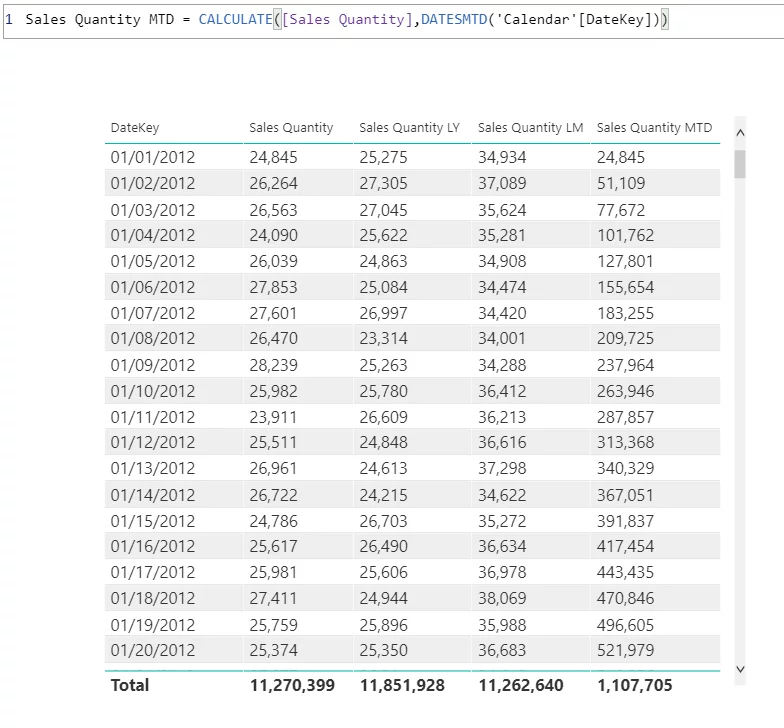
If you want to calculate any running totals for your metric(s) by Month-to-Date (MTD), Quarter-to-Date (QTD), or Year-to-Date (YTD), these functions are of tremendous help out of the box.
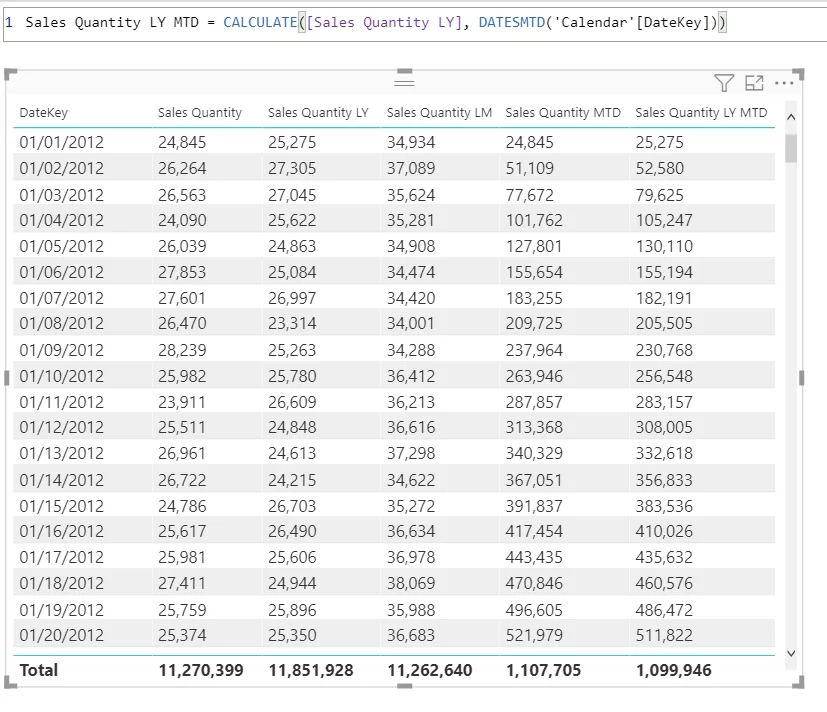
Month-to-Date (MTD) Calculation for Sales Quantity: (Screenshot below)
What if you are trying to compute Sales Quantity for the Previous Year’s MTD/YTD/QTD?
There is a neat trick to it. See screenshot below for Previous Year’s MTD calculation.
If we just substitute the Sales Quantity measure with Sales Quantity LY, keeping our DATESMTD function applied, it does exactly that, cool stuff.
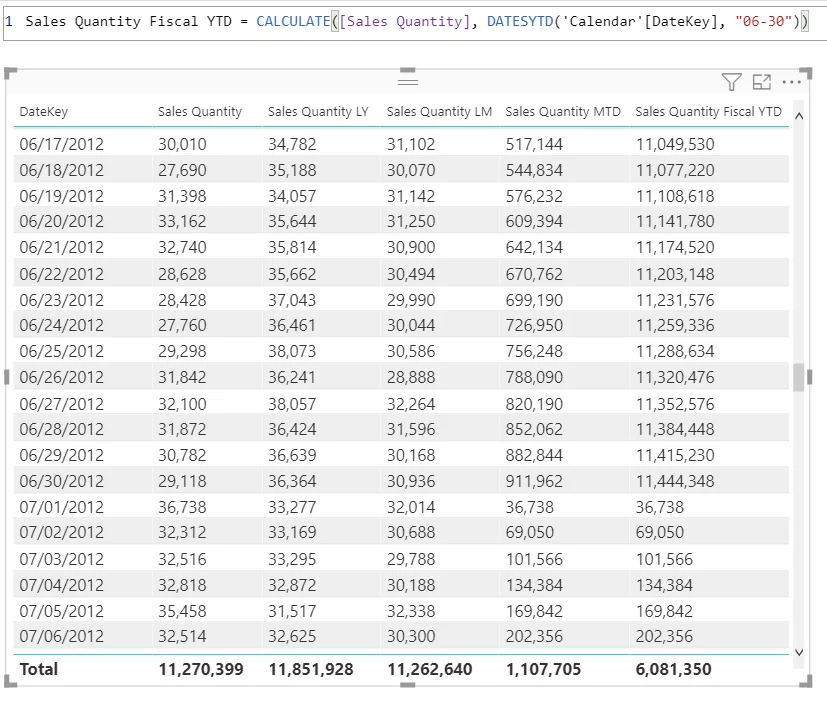
What if you need to calculate YTD Sales according to Fiscal Year and not by Calendar Year?
For that, we need to explicitly provide the function DATESYTD() with a parameter for the Fiscal Year’s ending date.
The value “06-30” show that our fiscal year ends on this provided date, & the YTD running total calculation is being computed starting from 1st July to 30th June.
Conclusion:
So, there you have it! You can do a lot more with these functions as they are the perfect solution for time intelligence problems. And most importantly, these calculations are dynamic, meaning if I place any filter, e.g., Location, Product Type, these calculations will reflect the data for those selections (provided the data model has the existing relationships).
Feel free to reach out to us if you have any questions by using the comment box below!


