

In our previous blog, “MS Dynamics CRM – Performance Testing through StresStimulus – Record and Execute,” we discussed how we can setup StresStimulus through different parameters to execute and record performance testing scripts. We also investigated how we can manipulate parameters based on our requirements for load patterns.
In this blog, we will be learning how to install a performance monitoring agent. A performance monitoring agent allows users to extract performance stats from an executed record script in a graphical format.
Why is the performance monitoring agent required?
- With performance testing, we want to find out how our application performs when a certain number of users located globally generate traffic on our web application. By installing a performance monitoring agent on the desired machine, we can analyze the following essential actions:
- How our site or app reacts under load?
- What is the response time for a given number of concurrent users?
- How much memory is consumed?
- How much time is spent waiting for disk reads and writes?
- What’s the database response time?
Working with Performance Monitoring Agent
The StresStimulus uses a PerfMon Agent to monitor servers connected via the internet or other networks where cross-machines communications via port; TCP 139 is not allowed.
To work with the StresStimulus performance monitoring agent, you first need to install it on the machine that needs to be monitored (it could be a Server or Virtual Machine). Once it is installed, you need to configure the performance graph to view the results.
Installing PerfMon Agent
StresStimulus and Performance Agent are packed together in the same StresStimulus system file downloaded from their official website. To install it, run the StresStimulus installer.
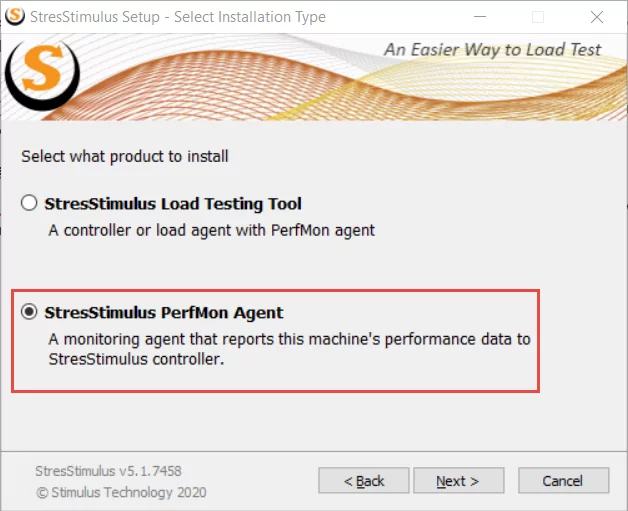
- Select the StresStimulus PerfMon Agent option from the Installation Type screen and then click on “Next” to proceed.

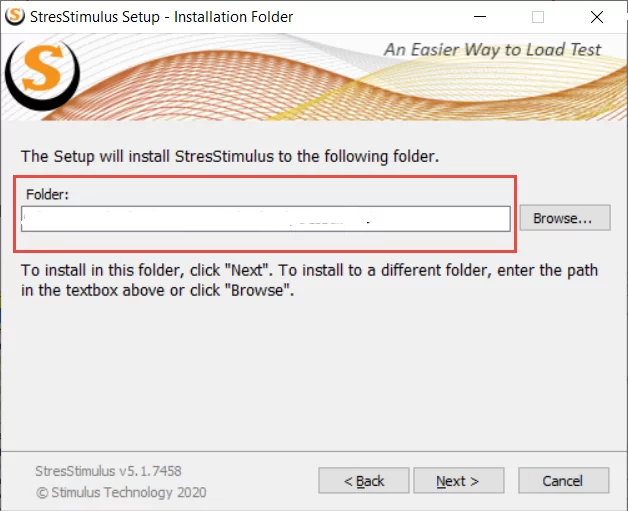
- Now we need to specify the installation folder.
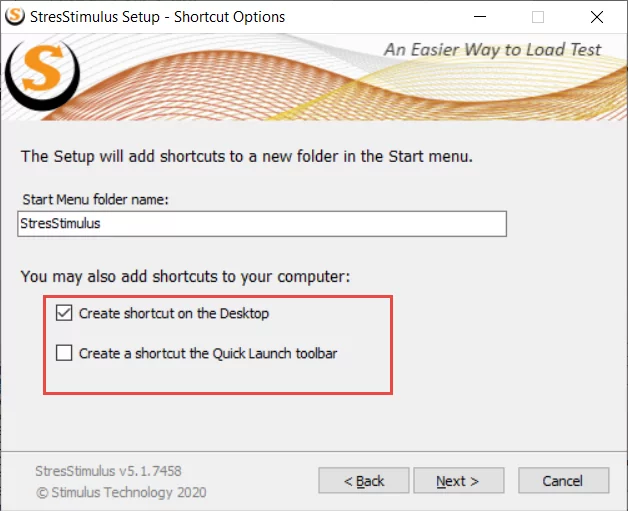
- Click on “Next” to select the shortcut options.
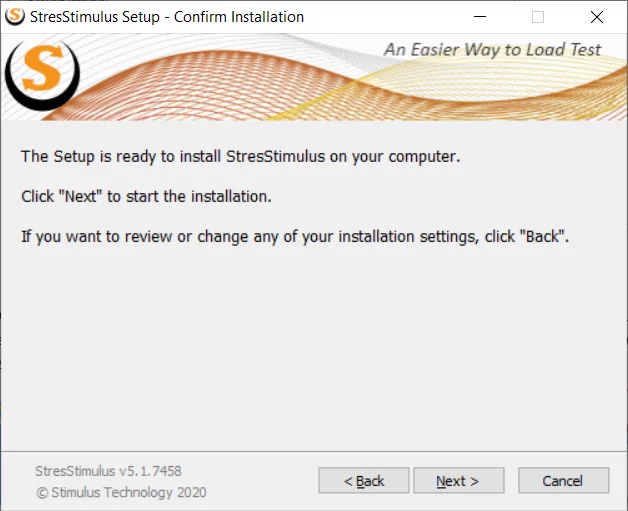
- Click on “Next” to start the installation.
If the desired machine already has a StresStimulus Load Testing Tool, you should not install PerfMon Agent. However, if PerfMon installation is required on that machine, you need to uninstall the Load Testing Tool.
Configurations required for PerfMon Agent?
The PerfMon Agent will start listening on TCP port 49996. You can easily start/stop the service or change the listening port by opening the StresStimulus PerfMon application.
To monitor the performance of multiple applications, windows based-web applications, database servers or Linux based applications, associate performance graph to the load agent. Performance Graph displays a bunch of performance parameters from one or several machines. All of them hold performance metrics during execution and are presented on the test report.
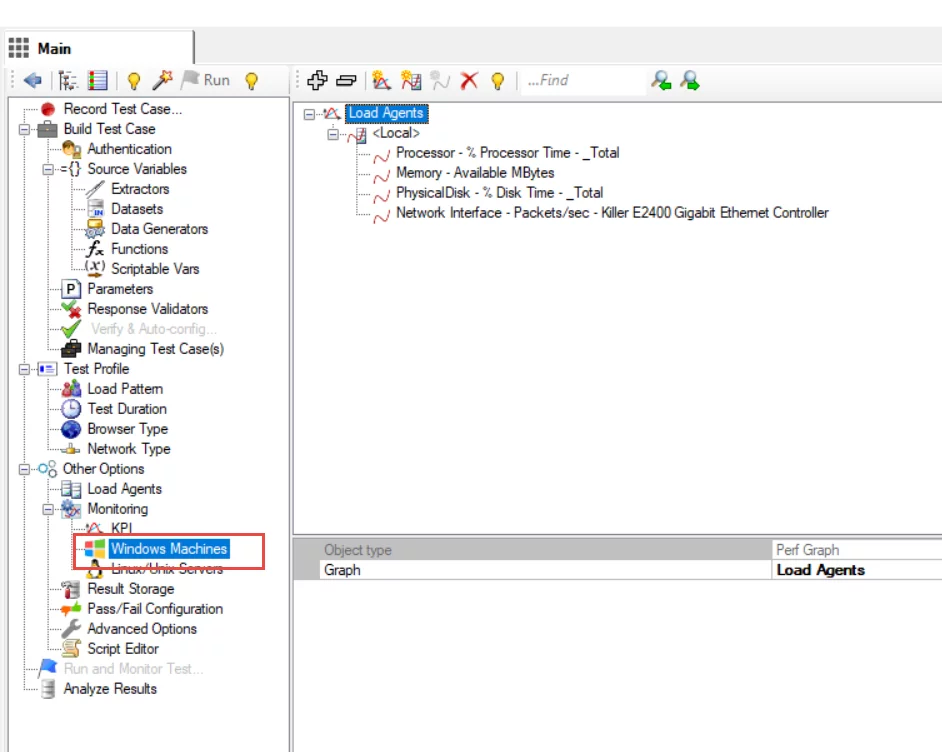
- From the StresStimulus, select the windows machine option under the monitoring field.

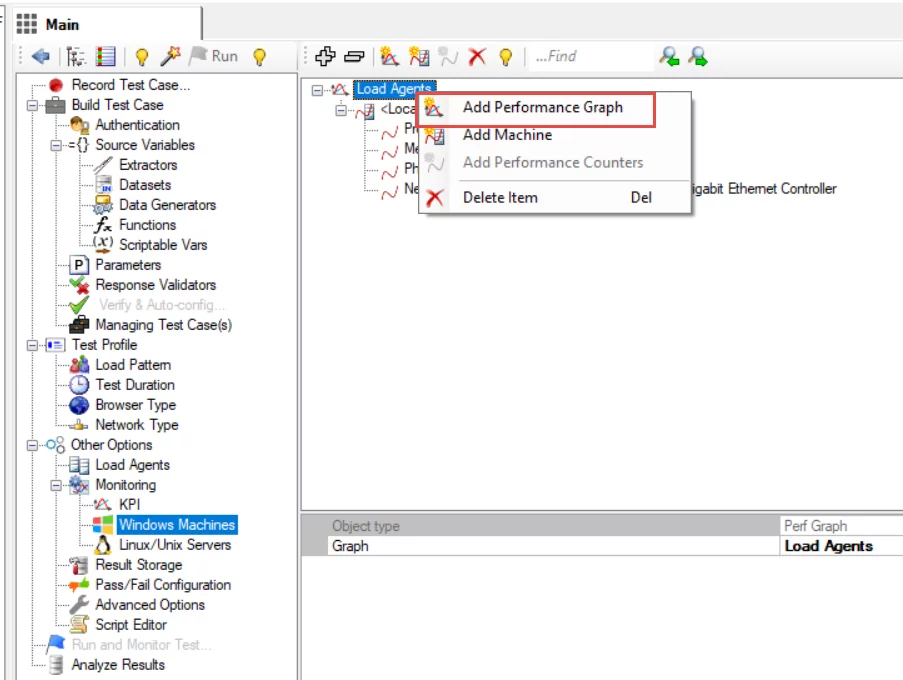
- Right-click on Load Agents and select the add performance graph and machine option from the monitor dialogue box.

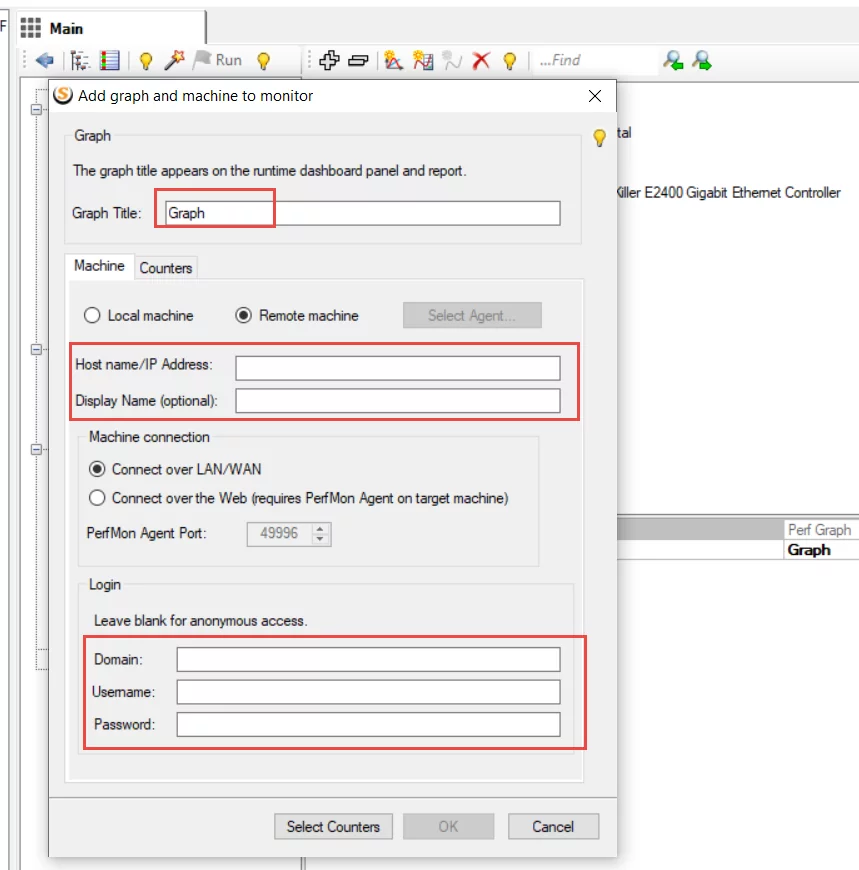
- Enter the graph title, the URL of the server, the Display Name, the Domain, and finally, the Username and Password. Click OK to save the graph and the machine (where the PerfMon agent is installed). A new graph node with a machine and a set of performance counters will appear on the graph tree.

- After this, you need to add several counters that will be available in the counters tab. You can select various initial counters from the Quick List.
- Processor – {machine name} > Processor > % Processor Time > _Total
- Available memory – {machine name} > Memory > Available Mbytes
- Disk – {machine name} > PhysicalDisk > % Disk Time > _Total
- System > Context Switches/sec
- TCPv4 > Segments Sent/sec
- Network – {adapter name} > Network Interface > Packets/sec
Running and Monitoring Test
When the test has begun, another tab showing the Runtime Dashboard will open. It will provide all the test execution options and controls to the user. The user can thus stay focused on the execution.
Users can view the test progress with the grid and graph from the dashboard.
Parameters for Performance Analysis
Application Performance is dependent on various factors like a response, speed, and underlying resources. Therefore, once our test run is completed, we need to consider the following critical parameters. We will make sure to analyze the data of these parameters for reporting purposes critically. All the below parameters are our counters, which we selected while adding a graph.
Users: The maximum number of users is fewer; this means that the systems are more efficient in processing the users from the start of the Testing scenarios towards the end. The maximum concurrent users on the system are less, resulting in more performance efficiency.
Memory – Available MBytes: This parameter helps us analyze the amount of physical memory available for processes on a computer.
%Disk Time: This parameter helps us analyze the amount of time the disk takes for executing a read or write request.
%Processor Time: This parameter helps us analyze the percentage of time the processor spends working on productive threads.
Context Switches/ Sec: Context Switches defines the frequency at which the CPU switches the threads, which are incomplete during the designated period.
Segments Sent/ sec: Network traffic in Windows is measured at the lowest level hardware interface and at higher network protocols, such as TCP/IP. This parameter counts the number of segments sent per second.
Conclusion
A very critical part of performance testing is the output of our tests. Therefore, we always need to be careful when monitoring our test execution and performance stats. As our final test report is based on our test results, we need to ensure that our test results are accurate. Accurate test results allow users to take timely, suitable actions such as application-level code refactoring or fine-tuning the hosting servers.
I hope that this blog has helped bring clarity to your performance testing endeavors. If you have any questions or insights, feel free to leave a comment below! Happy testing.
If you have any question or queries, do not hesitate to reach out to us!
[ninja_form id=4]