

Introduction
This blog is the fourth and last part of the Big Data Analytics blog series. In this blog, I will explain how to build Analytics in Power BI that can run on billions of rows. We will talk about the architecture of the Microsoft Power BI engine and how it runs analytics on big data.
If you have missed out on the previous blogs, click on the links below:
Microsoft Power BI Architecture
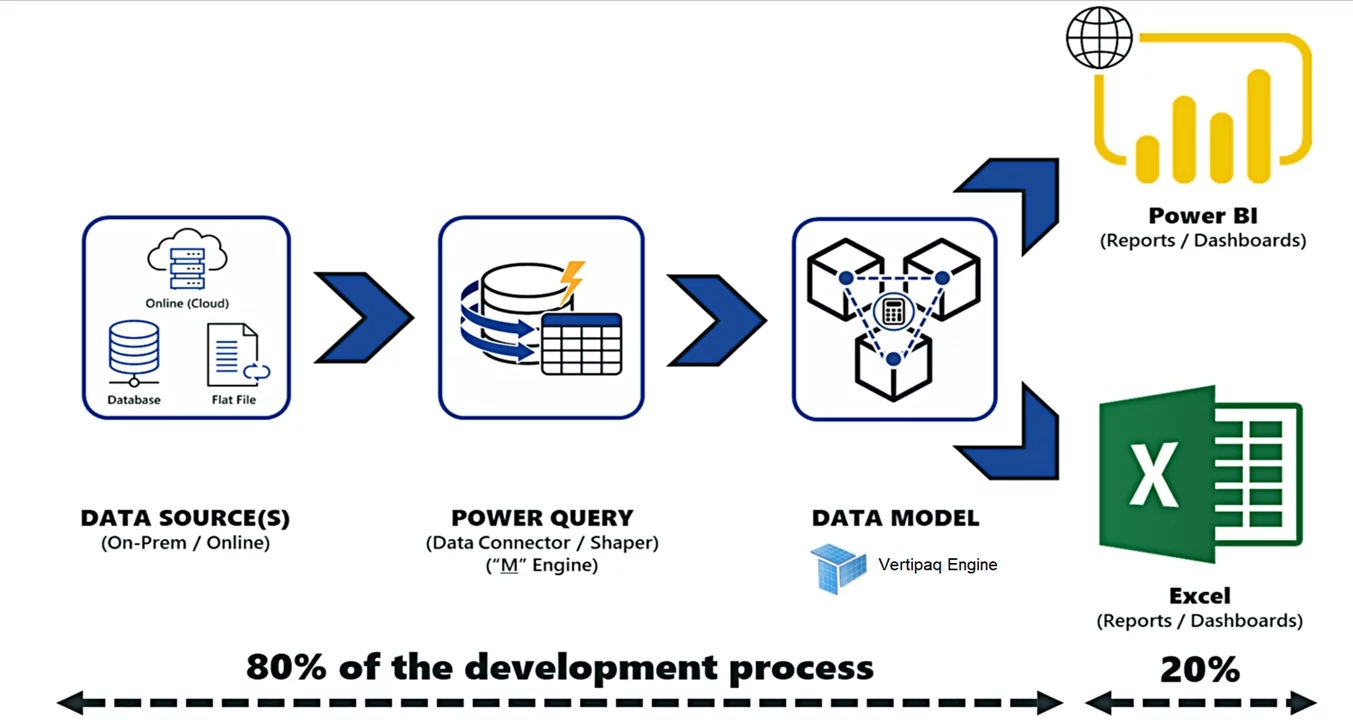
Power BI is a leading data analytics BI tool that has enabled data culture in multiple organizations. Power BI users can perform self-service BI, Enterprise BI analytics, and Big Data analytics all in a single Power BI Desktop and Power BI service. In a typical Power BI project, it takes 80% of development effort on data massaging, cleansing, and data modeling, and only takes 20% of effort on making visuals and artifacts.
We create Power Query (M Language) data extractor scripts to source data from the outer world. If we are using the import storage mode, then Power BI will move all the data into the Power BI data model using the Power queries. Once we have data in the Power BI data model, then the VERTIPAQ engine kicks in. Storing data in tabular cubes, performing I/O compression, applying filters, joining tables, and doing basic aggregations are the engine’s responsibilities. Behind the scenes, the Power BI data model creates the Analysis Services Tabular Cubes as a storage strategy. DAX language is used by the Vertipaq engine to slice and dice the available data on tabular cubes.
Learn more about our BI Services
These are the steps for the PBI cube processing:
- Reading data from the source, transforming it into a columnar data structure of VertiPaq, encoding data available in each column.
- Indexing for each column.
- Creating Data structures for relationships.
- Computing the calculated columns
This engine makes Power BI the best Analytics platform when it comes to performance.
Power BI AGG Tables for Big Data Analytics
Now I want to show you how Power BI aggregation features help us run analytics on big data sources.
Aggregations in Power BI helps us reduce table sizes so that we can focus on essential data and improve query performance. Aggregations enable swift and agile analysis over big data in ways that are not possible using traditional methods. It can, thereby, reduce the cost of exploring large datasets for decision making.
In Power BI, Aggregations start as tables just like any other table in a data model but with fewer rows than a detailed table.
Once in the model, these tables can be configured to answer queries by the engine. For instance, we have two tables, as shown in the following image:
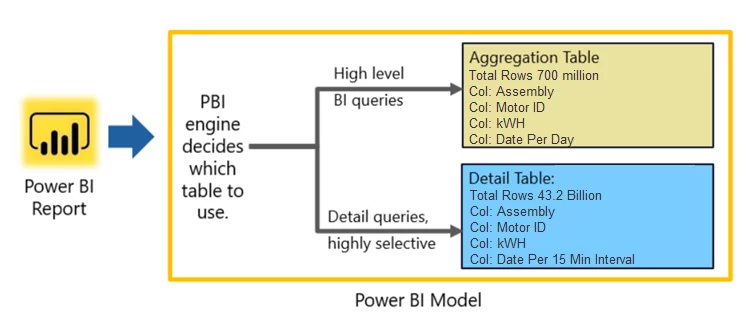
One table has day level granularity, and the other table has actual data with 15 min interval granularity. If someone is interested in getting information on the daily usage trend, then the PBI engine will redirect the query to the Agg table. If someone is interested in getting information on the hourly trend per day, then the engine will redirect the query to the detail table. This redirection of request is completely dynamic, and the Power BI engine decides on runtime time. For most cases, we keep a detailed table on Direct Query mode to save the data size in the PBIX file. As you can see Agg table has only 700 million rows, and it is easier to run queries on it than running queries on 43.2 billion rows table.
Benefits of Aggregation
- Better query performance over big data: Each Power BI Visual action sends DAX queries to the dataset. The cached aggregated data uses a minimal amount of resources for detailed data, so that one could unlock otherwise inaccessible big data.
- Optimized data refresh: Smaller cache size reduces refresh times, allowing the data sets to be much faster.
- Balanced architectures: The in-memory Power BI cache can handle aggregated queries, limiting requests sent in DirectQuery mode. The remaining detail-level queries tend to be filtered, transaction-level queries typically handled well by data warehouses and big-data systems.
Explore our BI Services
How to Configure Aggregation
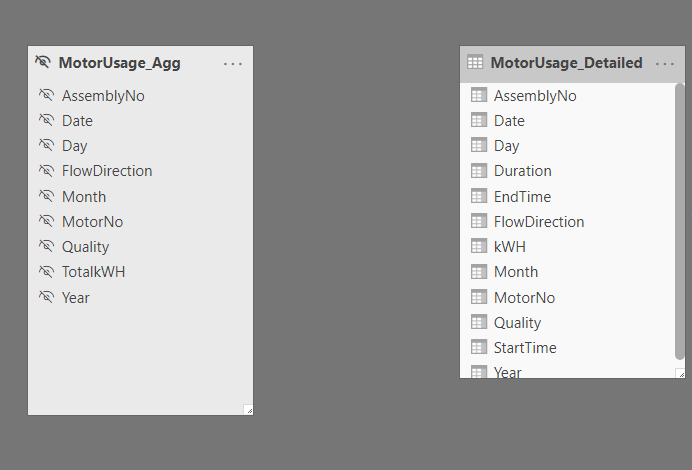
Step 1: Import summary table (MotorUsage_Agg) from Azure Synapse to Power BI data model
Step 2: Source detail table (MotorUsage_Detailed) in the Power BI data model and set its mode to “Direct Query.”
Step 3: Now, we have two tables in the data model, one with 700 million rows and set to Import mode, and the other has 43.2 Billion rows and set to Direct query. Hide the MotorUsage_Agg table so that the end-user does not use it for analytics;. Power BI will use it as active data caching.
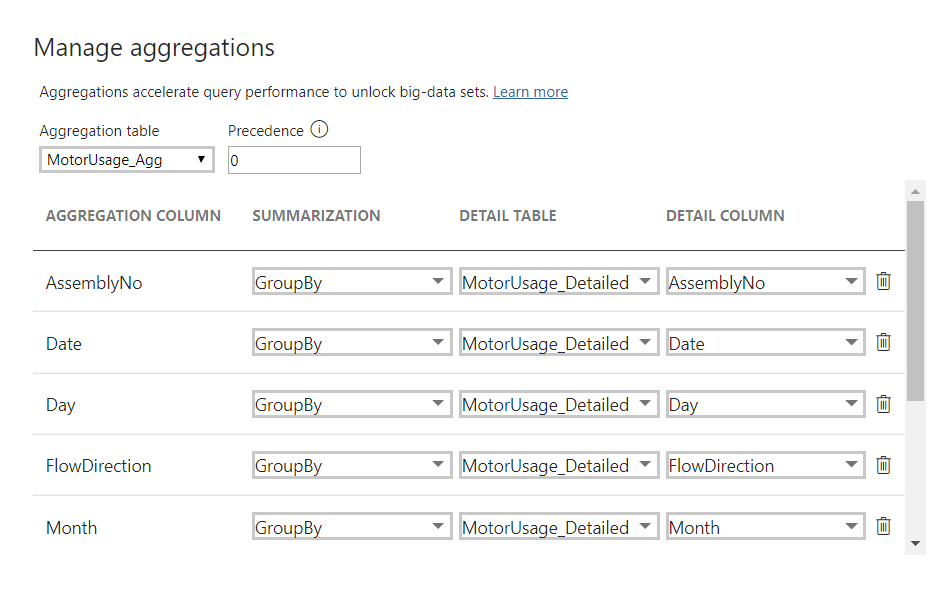
Step 4: Click on MotorUsage_Agg properties and go to Manage Aggregation
Step 5: Set the summary and detail table column association with the required granularity. After providing the column mapping, Power BI will automatically decide which table should be used to get the appropriate answers.
https://docs.microsoft.com/en-us/power-bi/transform-model/desktop-aggregations
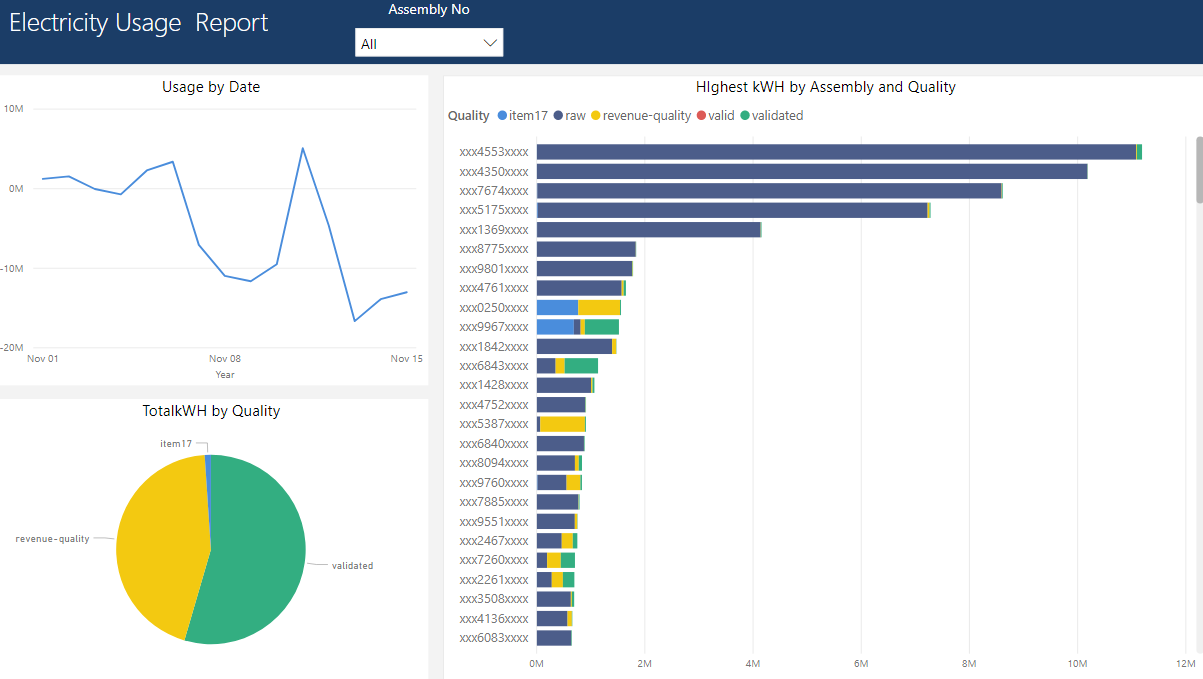
Power BI report
Charts and visuals rendered in this report are getting data from 43.2 Billion rows or 700 million rows table based on the date granularity in visual. The response time is as fast as lightning if the user performs analysis on the day level. If the user goes deeper in detail for a day, then Power BI will fetch data from Azure Synapse to fulfill this request.
Summary
In this blog series, we have built Azure Data Lake Gen 2 pool to host CSV files and then implemented cloud DWH in Azure Synapse. In the end, we have built Analytics on Power BI to get daily electricity usage trends of all motors. Finding answers and gaining insights from the enormous amount of data with a quick response is the key to success. Therefore, response time is crucial in such scenarios.
I hope that this blog series has allowed you to gain a deeper insight into big data analytics and the Azure platform. If you have any questions or comments, please do not hesitate to reach out to me. I am happy to help!
If you have any question or queries, do not hesitate to reach out to us!
Think Big!
[ninja_form id=4]