Introduction:
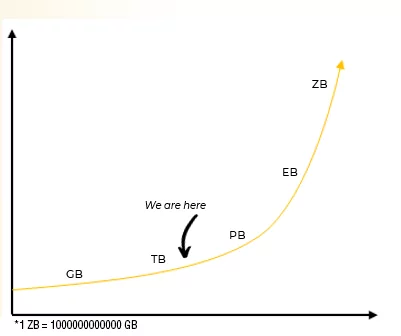
Big data analytics examines large amounts of data to uncover hidden patterns and to find business insights. In this blog series, we will talk about running analytics on petabytes of data using a big data solution capable of handling large scale data. One important aspect of any big data project is unstoppable data growth. Solution architects need to take this into consideration to build solutions that scale. In this blog, we will cover how to build a solution that could scale and handle large amounts of data. The platform that we have chosen to demonstrate this capability ensures that the solution’s performance will not be impacted even on petabytes of data scale.
Why is big data analytics important for your organization?
Most of the companies have terabytes of data. Designing big data solutions only for the initial load is not the only important phase. Big data solution architects should also ensure that the solution will perform and run analytics on petabytes of data in the future.
Benefits:
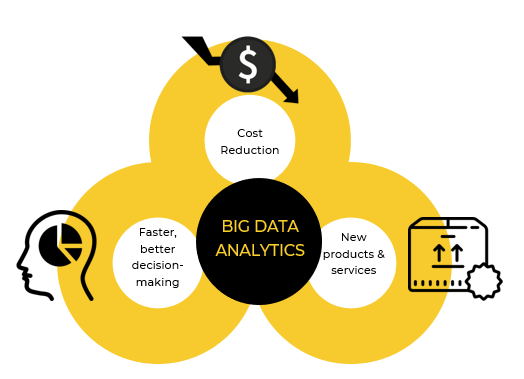
Once we decide on the best architecture and data platform for our big data solution, we can focus on its benefits:
- Cost reduction: When it comes to managing big data, using traditional methods is costly as compared to purpose-built big data technologies such as Hadoop or cloud-based analytics such as Azure. These services and platforms bring significant cost advantages when it comes to storing large amounts of data.
- Faster and better decision-making: Hadoop, Azure data platform, and in-memory analytics empower companies with speed and the ability to analyze new data sources. This allows businesses to make better, time-efficient decisions.
- New products and services: Big data analytics helps us to gauge customer needs or performance of sensors. This can also be used to identify what new products and services are required in specific areas and at what time.
Case Study: Electricity consumption of inductive motors
Let’s talk about big data in a case study. This blog series will teach you to design and implement a big data solution that handles billions of data rows.
Background of the use case:
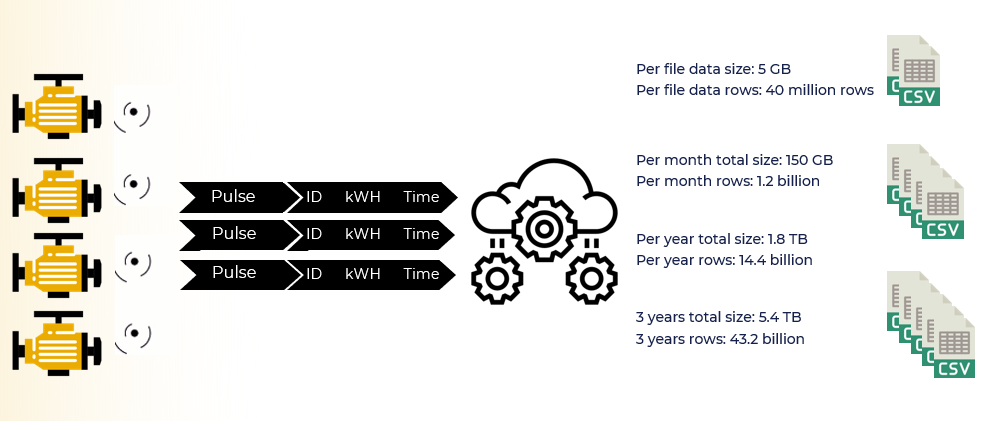
We will design a solution for a company that has factories around the globe and has thousands of small motors. This company has also installed sensors with these motors to send electricity usage data to the cloud for each motor.
Each sensor is responsible for sending delimited information to the cloud with a 15 minute interval. The delimited information consists of the motor’s ID, electricity usage in the interval, and the timestamp. The cloud service processes these records and creates a CSV file to capture complete daily usage.
Now Let’s do some math on the data yielded in this process. We will consider 30 motors for this calculation:
Data in one day:
One CSV file size = 5 GB
Rows in one CSV file =23 million
Data in One month:
Total Volume = 5 * 30 (motors) =150 GB
Total Rows = 23 million * 30 = 1.2 Billion
Data in one year:
Total Volume = 150 GB * 12 = 1.8 TB
Total Rows = 1.2 Billion * 12 = 14.4 Billion
Data in 3 years:
Total Volume = 1.8 TB * 3 = 5.4 TB
Total Rows = 14.4 Billion * 3 = 43.2 Billion
Now, this is huge! To handle this mammoth amount of data, we should adopt a big data platform that guarantees to support this huge influx of the data. To meet these needs, we choose the Azure data platform and Microsoft Power BI. In the next section of the blog, I will explain the Azure data platform’s services and how they will help us manage data.
Architecture diagram of the solution
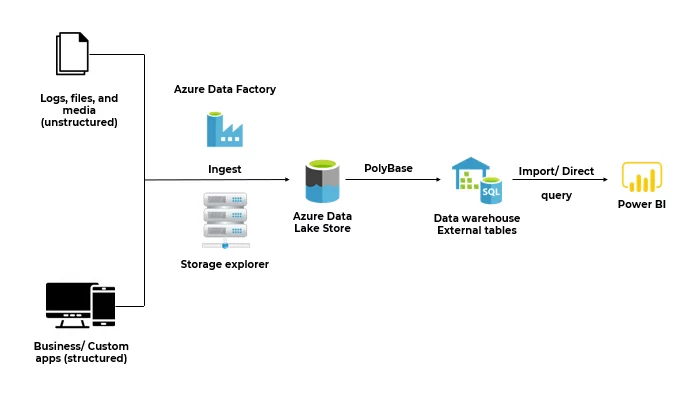
Process:
- Move CSV files from the on-premises server to Azure Data Lake Gen 2 using Azure Data Factory. We can also use Azure Storage Explorer to move the data from the on-premises to the cloud.
- Create External tables in Azure Synapse using Polybase to source data from Azure DL Gen 2.
- Perform Data orchestration in Azure Synapse. Create a summary and detail tables in DWH.
- Create a Power BI report to fetch data from Azure Synapse and implement the table aggregations in the Power BI data model.
List of Azure Big Data services
- Azure Data Factory
- Azure Storage Explorer
- Azure Data Lake Gen 2
- Azure Synapse
- Polybase
- Power BI
Benefits of Predictive maintenance solution
This is a turnkey solution that is easily customized to suit the precise needs of your manufacturing processes. This solution is a predictive and preventive maintenance solution. We can predict the potential failure of the motors based on the electricity consumption trends. We can prevent the potential failure on production lines by replacing malfunctioning motors from assembly lines. The following are the benefits of using this solution.
- Limit the quantity of unforeseen breakdowns and increase uptime, which improves resource dependability.
- Reduce operational expenses by accurately forecasting maintenance needs rather than prescheduled maintenance tasks.
- Increase business profitability by minimizing long-term maintenance costs and maximizing production hours.
Summary
In this blog post, we have discussed what big data is and why big data analytics is important for your company and the benefits that any company can gain by investing in big data projects. It is also very important not to re-invent the wheel each time. Building a new custom big data platform is not recommended as it will drain the budget of the project and still will not guarantee the performance. So, it is important to opt for a promising big data platform that could handle data load without boundaries. In this blog, I have presented the case study and solution to solve this big data problem. In our next blogs, I will explain each Azure service that has been used in this solution.
Part 2: Data Movement and Storage
[ninja_form id=4]