
In our previous blog posts on the topic, we discussed how we can set up StresStimilus and record and execute performance testing scripts. We also learned how to install the performance monitoring agent and configure graph that extracts the targeted applications/machines’ performance stats. If you missed out on our previous blogs, just click on the links below to read them:
MS Dynamics CRM – Performance Testing through StresStimulus – Record and Execute
MS Dynamics CRM – Performance Testing Using StresStimulus: Performance Monitoring & Graphs
In this blog, we will be discussing how we can obtain the results of the testing scripts and analyze them using different tabs of the test repository.
Displaying the Results
- Once the test is completed, the StresStimulus will perform the following actions automatically:
- The results of the executed test will be made available in the repository.
- The dashboard responsible for monitoring the runtime actions and process will close.
- A new tab will open, showing the test results.
Please Note: There are several Views from where we can analyze different aspects of the application.
Walkthrough of the Test Completion and Results.
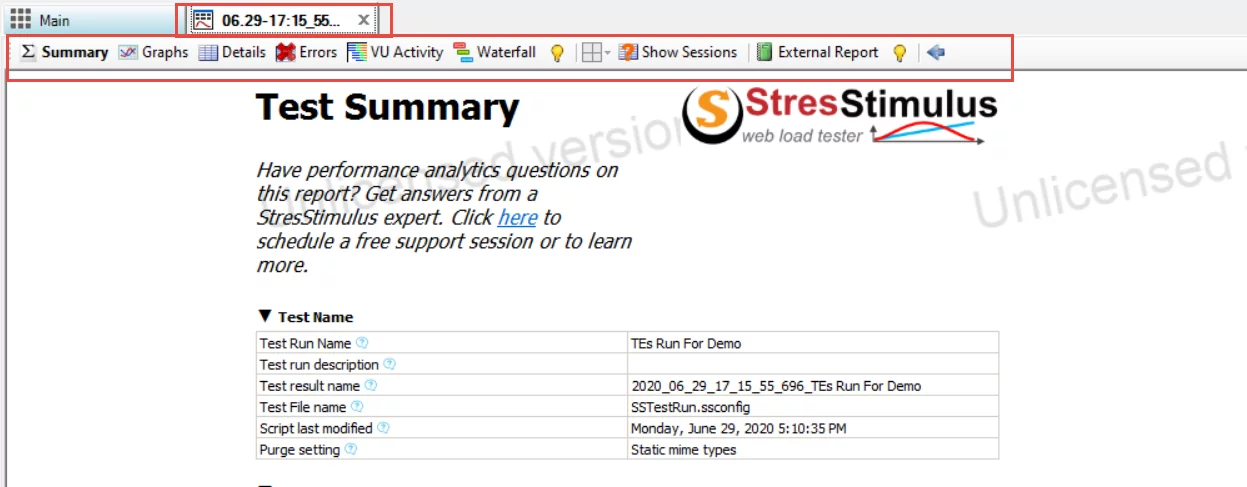
The screenshot below shows the test completion. You can also see the Test Results tab. The test result tab opens automatically and has the following views:
- Summary
- Graphs
- Details
- Errors
- VU Activity
- Waterfall
- Show Sessions
- External Report
We will be discussing each of these views independently.
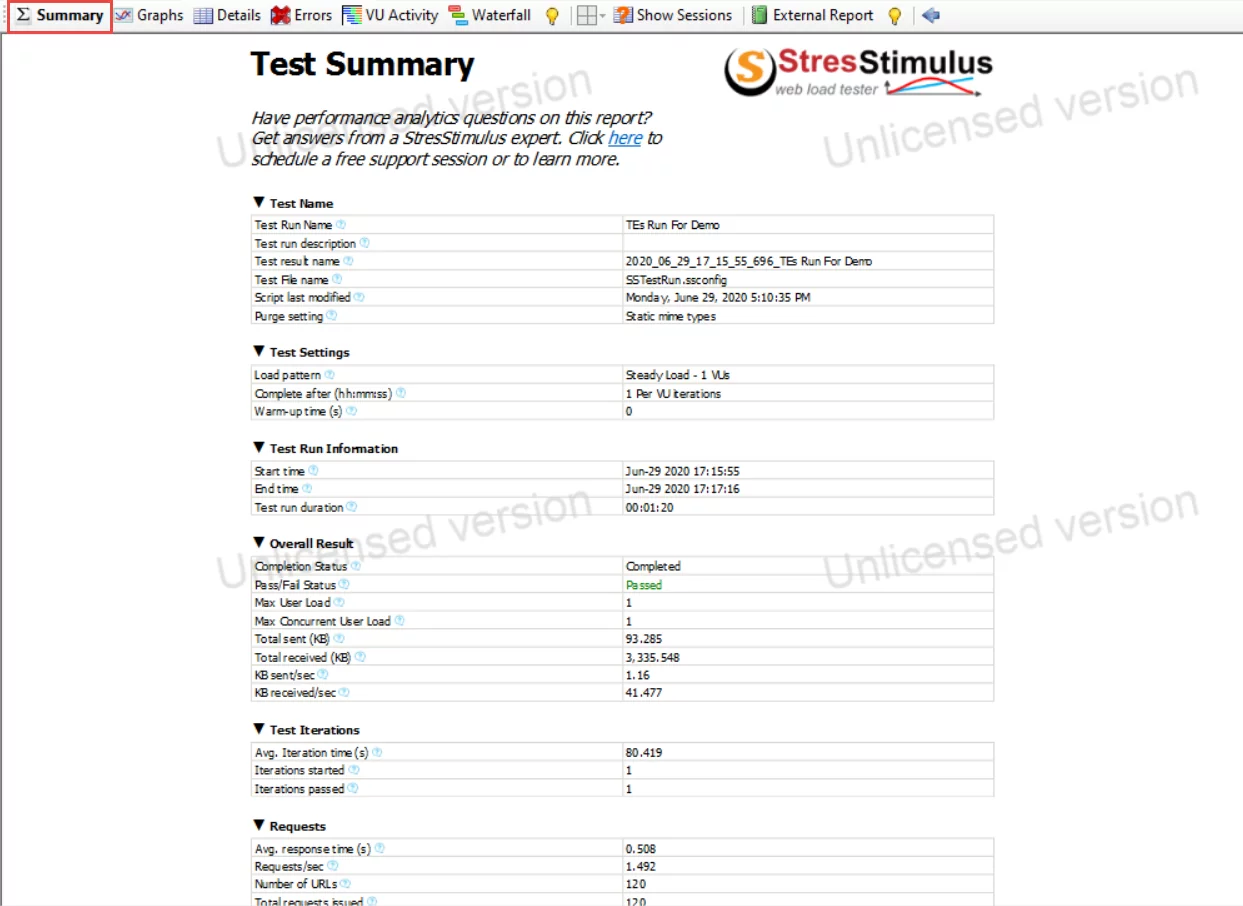
The first view, the Summary, holds the details of the complete test, i.e., the test name, the test settings, the test run information, the overall result, the test iterations, the request information, the transaction information, and the top errors.
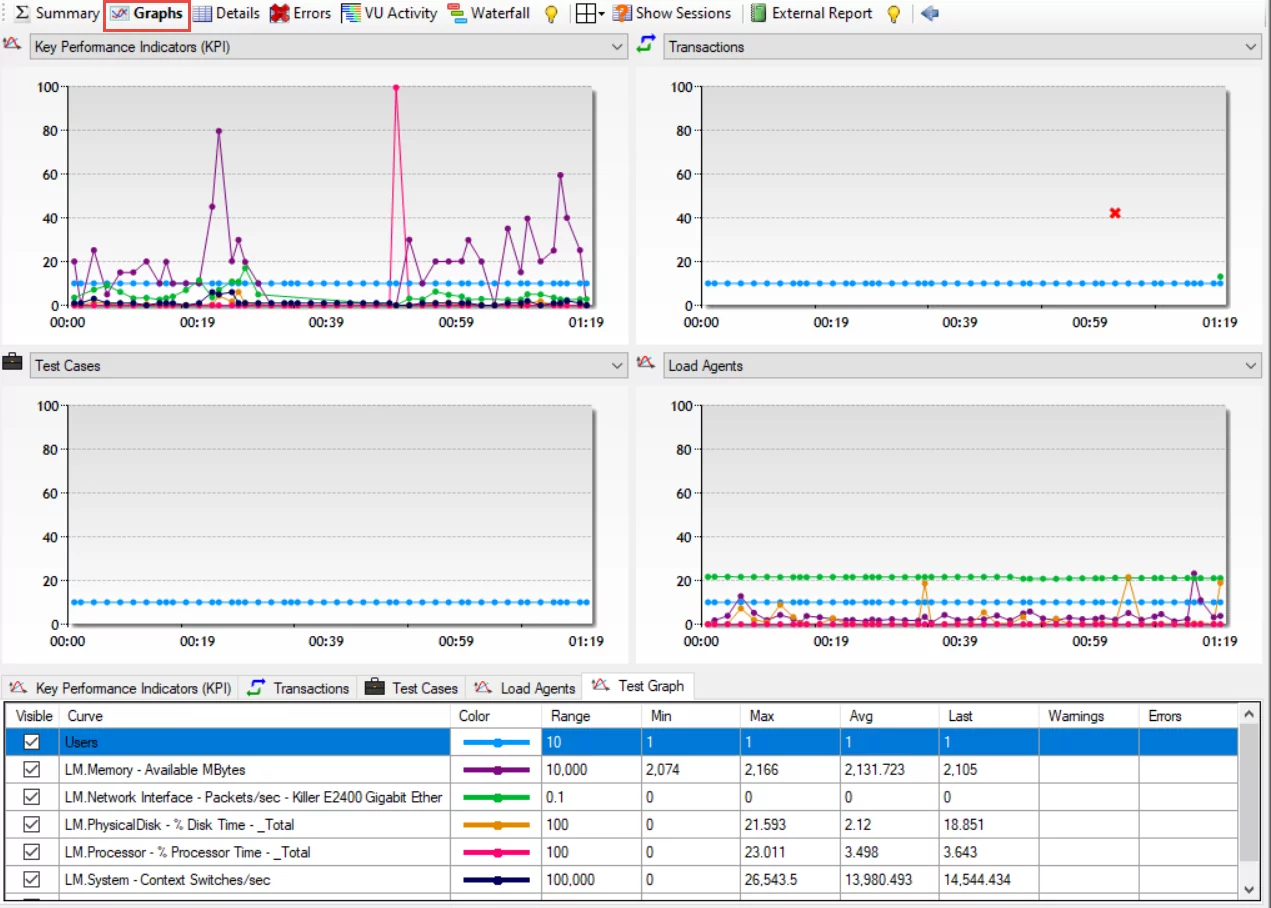
If you click on the Graphs view, you can extract the information regarding the KPI, the transactions, the test cases, the Load Agent, and the configured graphs. All these parameters hold information in the form of different counters (which can be seen in the Curve column) represented in graphical and tabular form.
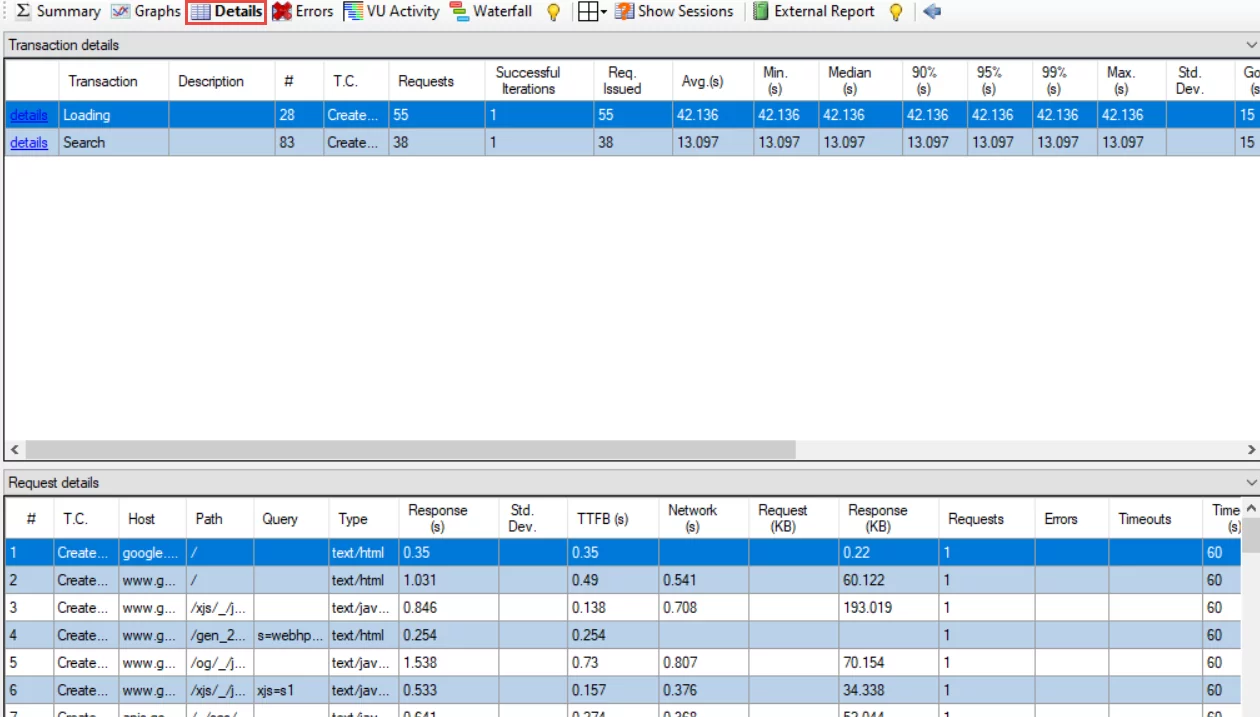
Clicking on the Details view will show you each transaction and the request details made during the execution.
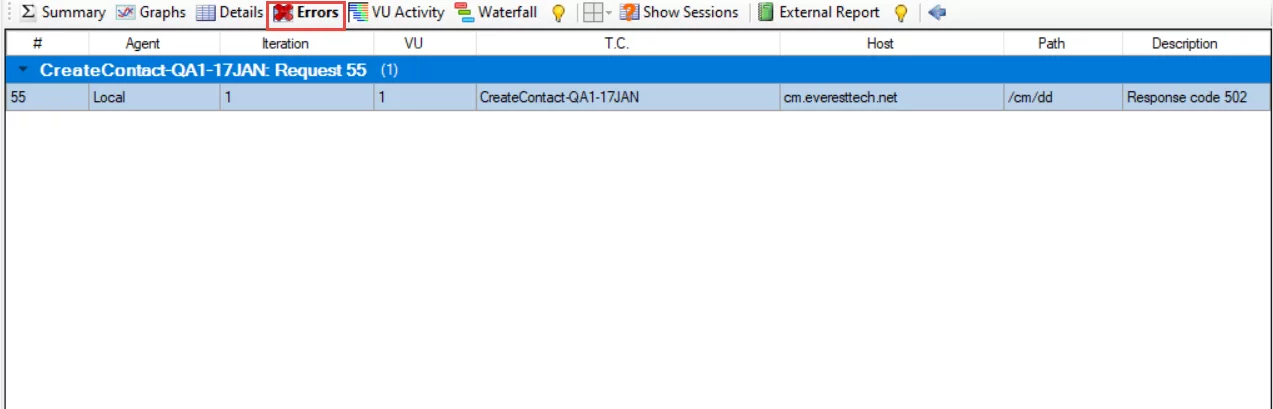
The errors that occurred during the execution can be tracked from the Errors view.
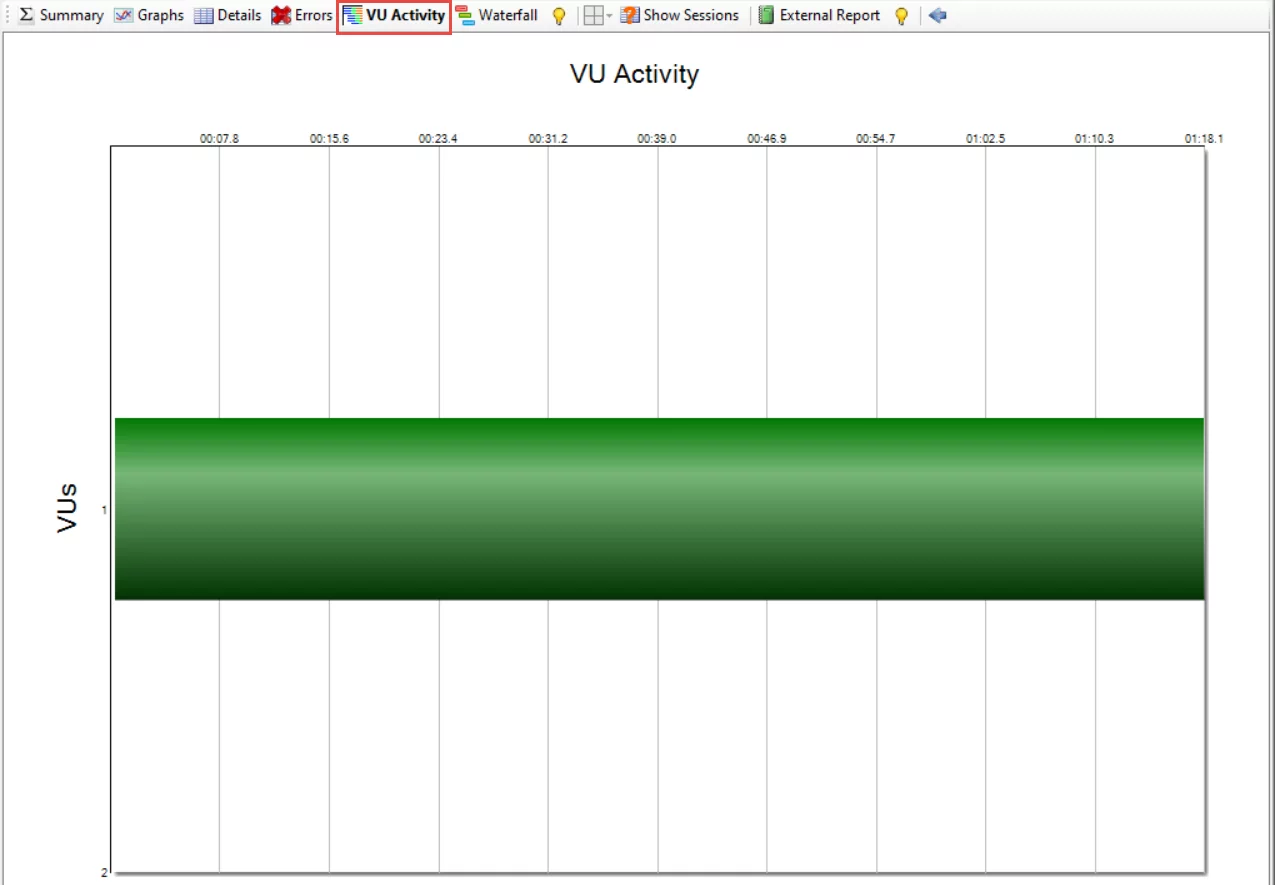
The activity of virtual users can be analyzed from the VU Activity view.
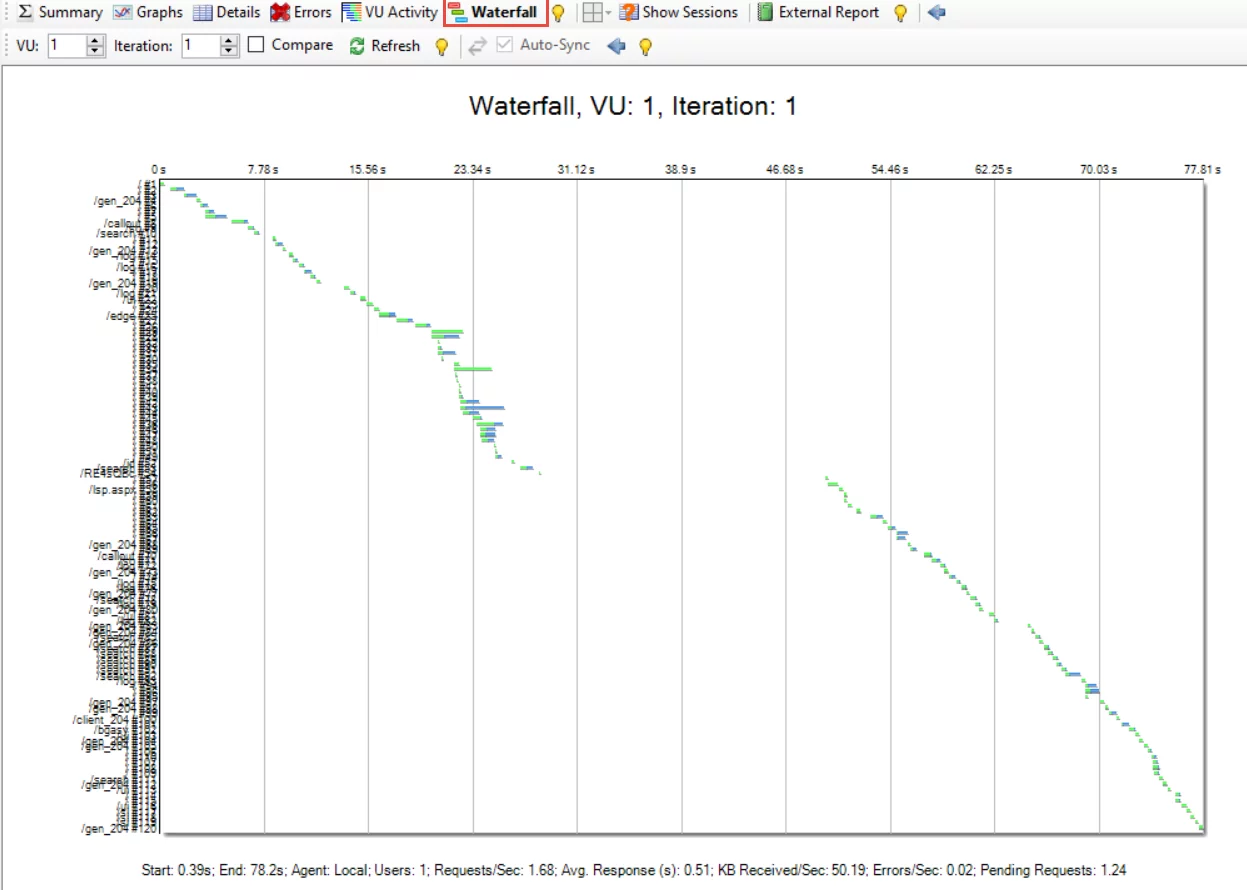
The Waterfall chart view shows the information about virtual users; Requests sent/sec, Avg. Responses, Errors/sec, and Pending Requests in the format shown in the screenshot below.
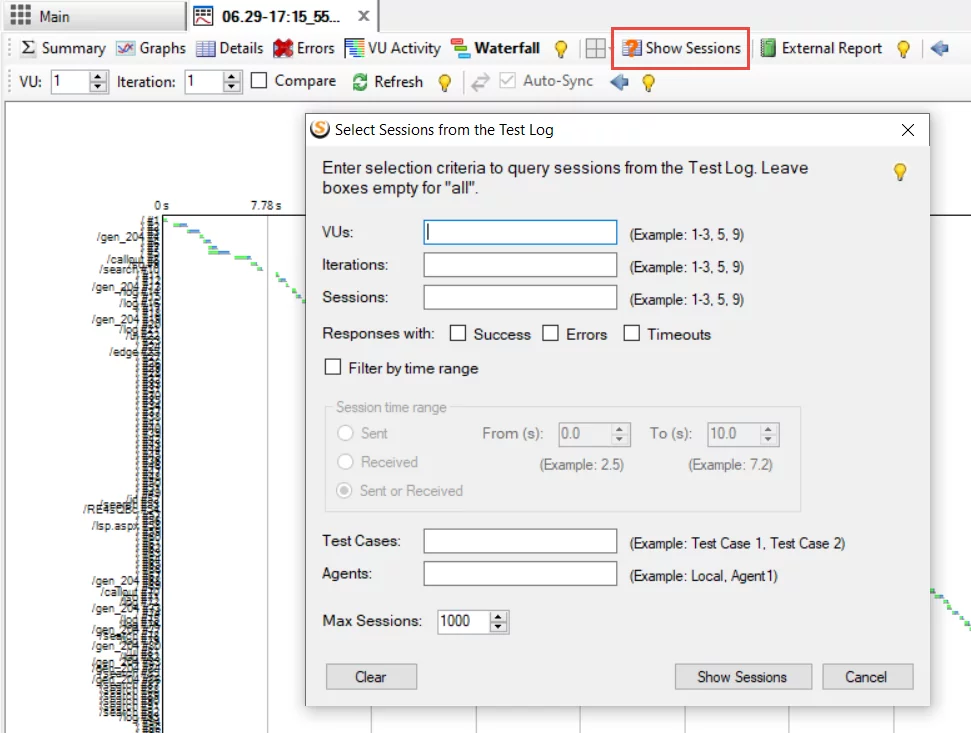
StresStimulus also provides the option to retrieve session information from the test log by applying filters. Once you click on Show Sessions, a query builder window will pop up where you will provide filters for the data to retrieve the session information.
The External Report view presents a test that brings about a convenient (HTML) design that can be disseminated outside StresStimulus. It incorporates information from the Test Result tab and the subordinate page/transaction result tabs.
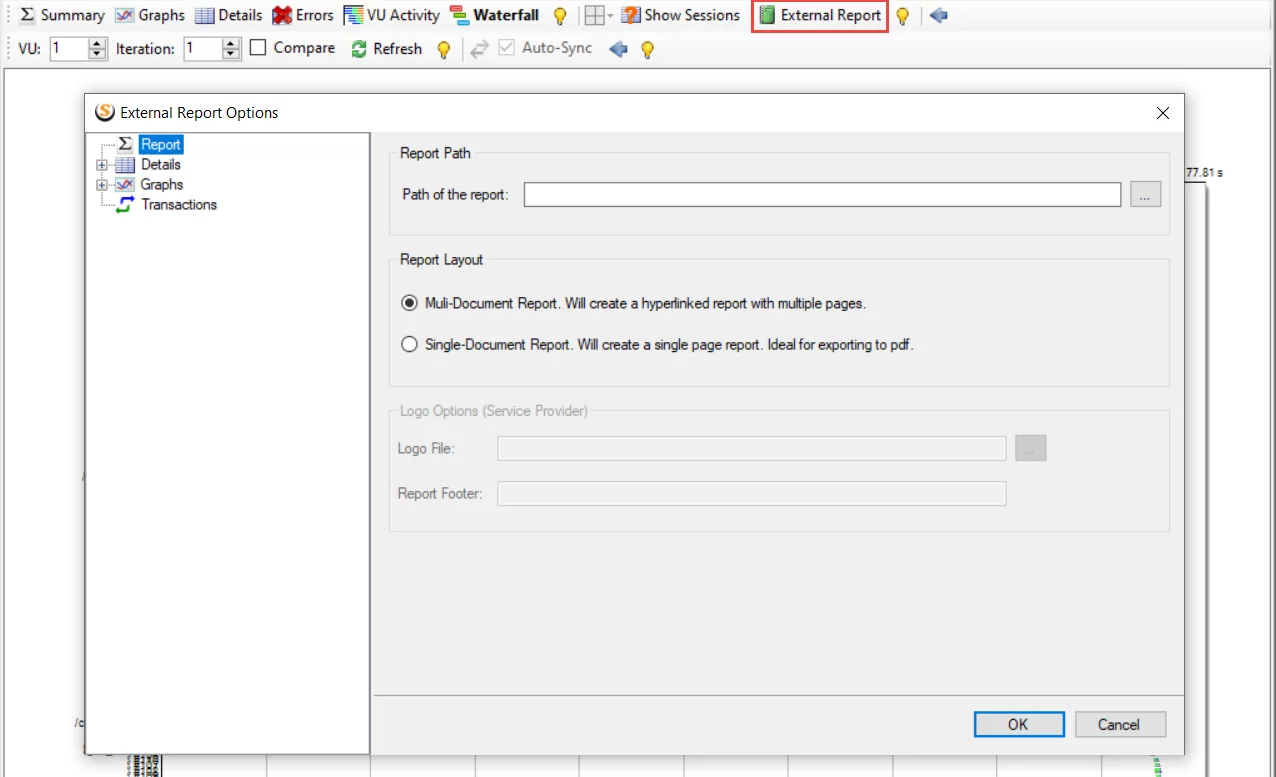
From the above information, you can quickly analyze performance information related to individual pages and transactions. You can also develop a report which will identify the shortcomings of the application/machine. Furthermore, you can also drill down layers of stack impacting performance.
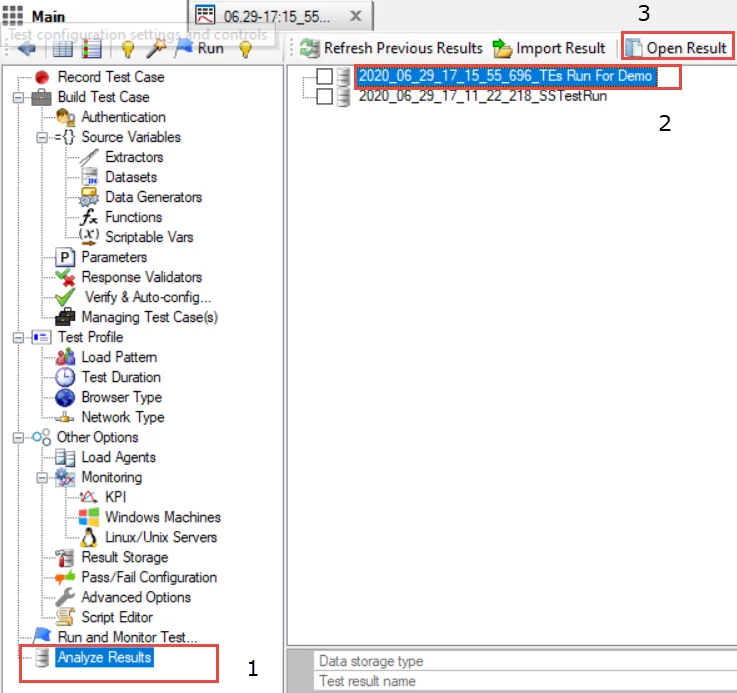
Opening the Results from the Previous Test Run
Each test executed in StresStimulus creates a different result set, which is stored in a separate repository. If you want to open the results of the previously performed test, it can be done easily by following the steps shown in the below screenshot.
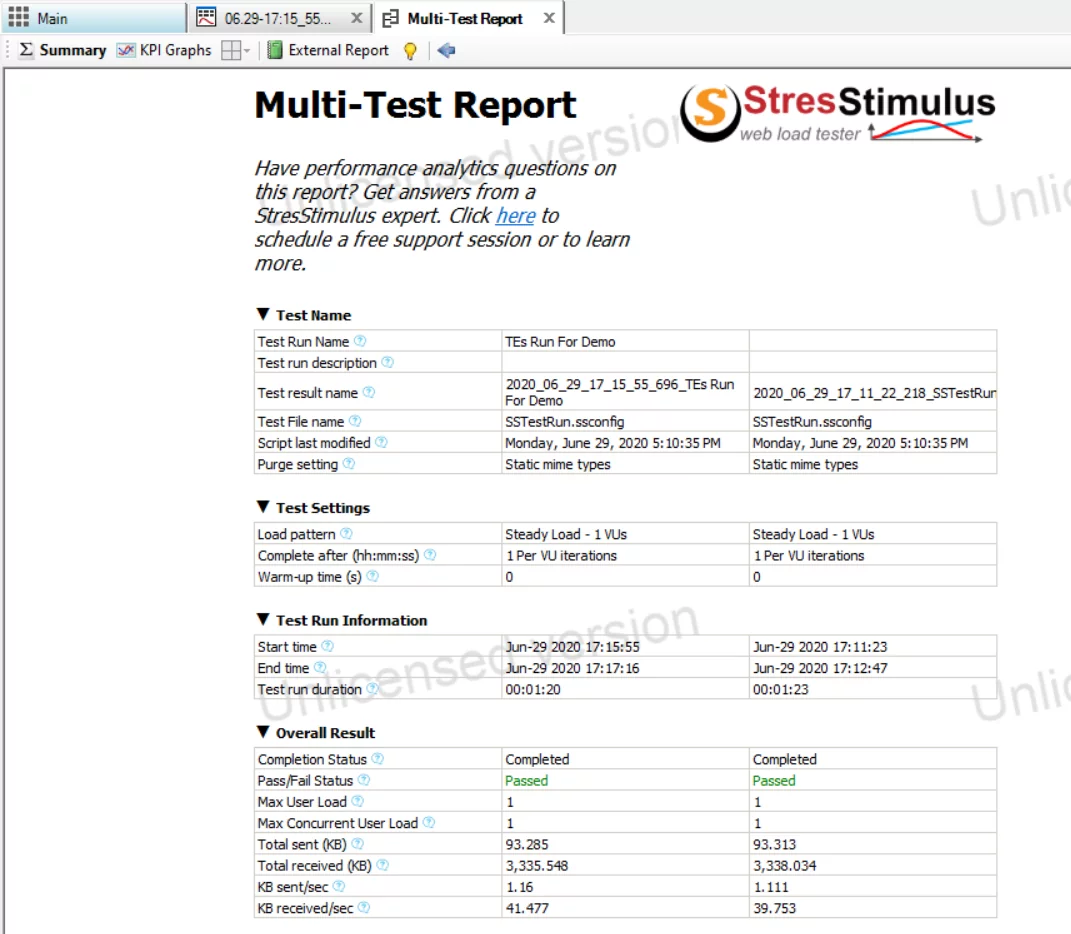
Comparing Test Results
You can also compare different test results by selecting the results file of the particular test run. In our case, we have executed two test runs, so we will select both files and click on the Compare Results button.
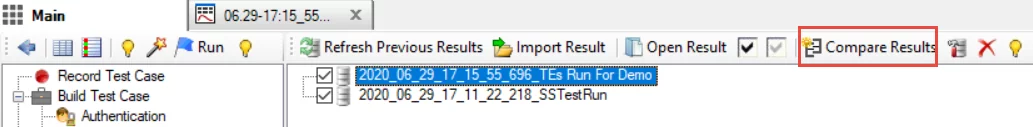
Now the results can be compared side by side easily:
Reporting
Application Performance is subject to different factors like a response, speed, and other fundamental assets. Along these lines, when our test run ends, we have to consider the following essential factors which perform a significant role in application or machine performance. We will make a point to investigate these factors in detail.
- Users
- Memory
- %Disk Time
- %Processor Time
- Context Switches/ Sec
- Segments Sent/ sec
The Test Results tab has different Views that can be used in your final performance Testing Report. The most critical and essential tabular data which must be included and clearly explained in your reporting document is the graph below. We have configured the graph before the test run. Upon completion of the test run, this graph will be populated with data referring to the following counters, which will determine our actual application performance. We will then take appropriate action to improve our machine and application performance.
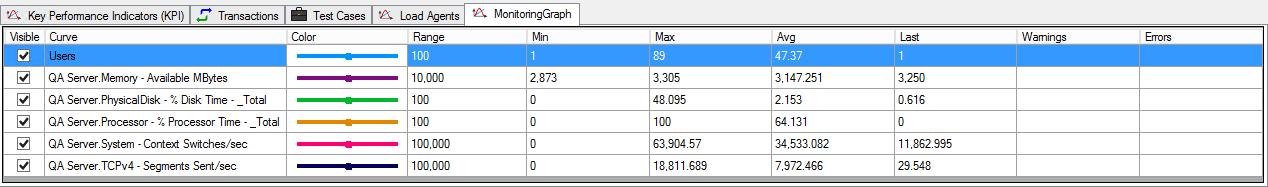
- Users: There is a cap of 100 users. As user sessions increase, the performance counters change to reflect the impact on the overall performance. Obviously, systems are more efficient in processing the users from the start of the Testing scenarios towards the end.
- Memory – Available MBytes: This parameter helps us analyze the amount of physical memory available to processes on a computer. The system is more efficient if there is more memory available.
- %Disk Time: This parameter helps us analyze the amount of time a disk takes to execute a read or write request—the lesser the percentage disk time, the more efficient the system.
- %Processor Time: This parameter helps us analyze the percentage of time the processor spends working on productive threads. The lesser the Processor time, the more efficient the system.
- Context Switches/ Sec: Context Switches define the frequency at which CPU is switching the incomplete threads during the designated time. If the Context Switches/ Sec value is high, the system is less efficient.
- Segments Sent/ sec: Network traffic in Windows is measured at the lowest level hardware interface and higher network protocol, such as TCP/IP. This parameter counts the number of segments sent per second
Conclusion
In this blog, we have learned how to perform the necessary steps for performance testing. We also learned how to achieve efficient reporting with the above counters and test result views. By following this blog series, readers can identify the glitches that impact their application performance, and based on that, and they can take appropriate actions to improve the performance of the machines and applications.
We want to conclude our blog on the following quote that drives our motto when it comes to testing:
“Lots of methodologies have come and gone, paradigms have changed, but the requirements are always the same; Make it good and make it fast.” – Anonymous
Happy Testing!