Table of Contents
Introduction
In the modern business era, data is not just a collection of numbers – it’s the heartbeat of insights. Imagine having puzzle pieces scattered across different rooms, each containing a fragment of your company’s story. Data integration is like a magnetic force that draws these pieces together and helps us see the whole picture.
Businesses generate data from sales, customer interactions, marketing campaigns, and more. This data often resides in separate systems, databases, and spreadsheets. Without data integration, it’s like having multiple maps with different routes to your destination. Data integration effectively consolidates these maps into one, forming a GPS that helps in making informed business decisions.
In this blog, we’ll dive deep into the details of data integration in business intelligence, exploring its significance, methods, and challenges.
Understanding Data Integration in BI
Data integration is the process of consolidating data from various sources, transforming it into a consistent format, and loading it into a centralized repository for analysis and reporting. It serves as the backbone of BI, enabling organizations to access a holistic view of their operations, customer behavior, market trends, and more. Data integration ensures that decision-makers have accurate, timely, and actionable insights at their fingertips.
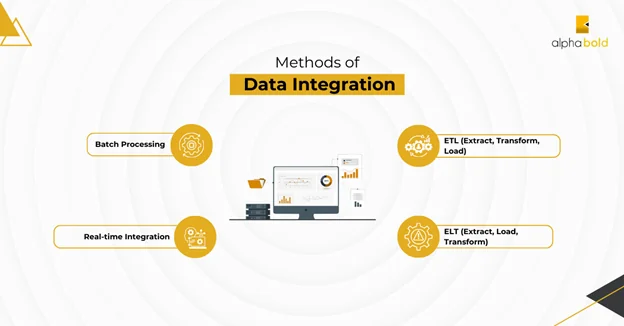
Methods of Data Integration:
- Batch Processing: Data from various sources is collected, transformed, and loaded into the target system in predefined batches. This method is preferred for its ability to streamline data processing tasks, optimize resource utilization, and enhance overall system performance.
- Real-time Integration: In this method, data is integrated and made available for analysis in real-time or near real-time. This is crucial for businesses requiring up-to-the-minute insights, such as e-commerce platforms.
- ETL (Extract, Transform, Load): ETL is a common approach involving extracting data from source systems, transforming it to meet the required format, and loading it into the target system. This method is helpful for data warehousing and analyzing historical data.
- ELT (Extract, Load, Transform): ELT reverses the order of the transformation process, first loading raw data into the target system and then transforming it as needed. This method is commonly used when the target system possesses robust processing capabilities.
Read more: Business Intelligence vs. Data Analytics
Data Integration Processes:
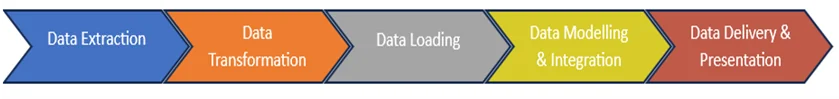
Data integration in Business Intelligence (BI) typically involves several key processes to ensure that data from various sources is collected, transformed, and made available for analysis. Here are the five main steps of data integration in BI:
1. Data Extraction:
The first step in data integration is extracting data from multiple source systems, including databases, data warehouses, flat files, APIs, web services, and more.
Data extraction methods vary based on the requirement of the BI solution. It may involve batch processes (scheduled or periodic extractions) or real-time extraction (continuous updates).
2. Data Transformation:
Once data is extracted, it often needs to be transformed to be usable for analysis. Data transformation involves:
- Cleansing: Identifying and correcting errors or inconsistencies in data to ensure accuracy and integrity.
- Enrichment: Adding relevant data or context to enhance analysis.
- Aggregation: Summarizing or grouping data to different levels (e.g., daily, monthly) for reporting and analysis.
Data transformation ensures that the data is accurate, complete, and in the right format for BI tools.
3. Data Loading (Extract-Transform-Load):
After performing transformations, data is loaded into a central data repository, be it a data warehouse or a data mart. ETL process includes:
- Load the transformed data into structured schemas designed for efficient querying.
- Preserve data relationships and integrity.
- Enable historical data tracking.
This step ensures that the data is available for analysis and reporting consistently and organized.
4. Data Modeling and Integration:
In this step, data is modeled to support the specific needs of BI and analytics. Common tasks include:
- Defining data relationships and hierarchies.
- Creating measures and calculated fields for analysis.
- Building data cubes or data structures for multidimensional analysis.
Data modeling ensures that the data is organized for efficient and meaningful analysis.
5. Data Delivery and Presentation:
The final step is delivering consolidated data to end-users through Business Intelligence reporting and visualization tools. This involves:
- Designing dashboards, creating reports, and developing interactive data visualizations.
- Enabling users to analyze and explore the consolidated data.
- Scheduling and automating report delivery to relevant stakeholders.
Data delivery and presentation make the insights derived from integrated data accessible and actionable.
Ready to Unlock your Business Potential?
Transform your data into a powerful asset – see how AlphaBOLD can revolutionize your approach to business intelligence.
Request a DemoThe Significance of Data Integration:
- Holistic Insights: Data integration enables the creation of a unified data repository by combining data from disparate sources. This gives organizations a comprehensive view of their business processes, leading to more informed decisions.
- Consistency and Accuracy: By transforming data into a consistent format, data integration reduces the risk of errors and inconsistencies arising from using data in its raw form. This improves the reliability of BI Insights.
- Operational Efficiency: Integrated data eliminates the need to collect and compile data from different sources manually. This boosts efficiency and frees up valuable resources for more strategic tasks.
- Efficient Reporting: Integrated data simplifies the process of generating reports and dashboards. BI professionals can access up-to-date information without manual data gathering and consolidation. This efficiency leads to faster reporting cycles and more agile & timely decision-making.
- Competitive Advantage: Organizations that effectively harness data integration for BI gain a competitive advantage. They can respond to market shifts faster, identify emerging trends and opportunities, and optimize operations based on data-driven insights.
Further reading 5 Challenges Solved By Business Intelligence Software
Challenges in Data Integration
- Data Quality and Consistency: Inconsistent or poor-quality data from different sources can lead to inaccurate insights. Data cleansing and standardization are vital to mitigate this challenge.
- Data Security: Integrating data from various sources requires careful consideration of data security and compliance with regulations like GDPR.
- Complexity: Integrating data from diverse sources with varying structures and formats can be complex and time-consuming.
- Maintenance: Data integration solutions need to be maintained and updated to accommodate changes in data sources and business requirements.
Experience a New Era of Business Intelligence with AlphaBOLD!
Our team of BOLDEnthusiasts specializes in delivering data-driven solutions to modern business challenges.
Request a DemoConclusion
Data integration serves as the foundation for successful Business Intelligence. It empowers organizations to make informed decisions based on accurate, consistent, and comprehensive insights. Embracing advanced BI tools like Power BI can streamline the data integration process, making it more efficient and accessible for organizations of all sizes. With the right data integration strategy in place, businesses can unlock the true potential of their data and pave the way for sustained growth and success.
Explore Recent Blog Posts