Table of Contents
Introduction
Project management dashboards built with Power Apps help teams track progress, manage resources, and maintain visibility across active initiatives.
For PMOs, they remain the main control point for understanding project health, identifying delays, and coordinating execution. That still holds true in 2026.
What has changed is the scale and complexity. Teams now deal with more dependencies, tighter timelines, and higher expectations for accuracy and accountability.
Traditional Power Apps dashboards that rely on static views and manual updates struggle to keep up. Visibility alone is not enough. Project managers need dashboards that surface relevant signals, reduce administrative effort, and support faster decisions.
Modern Power Apps project dashboards are adapting to these needs. They still show projects, tasks, resources, and budgets, but are now more contextual, responsive, and embedded in daily work.
Instead of requiring multiple screens or manual reporting, today’s dashboards focus on what changed, what is at risk, and where action is needed. The dashboard remains central to project delivery, with a more active role in guiding execution.
Why Power Apps Is the Right Platform for Project Management Dashboards in 2026?
Power Apps remains a strong foundation for project management dashboards because it balances structure, flexibility, and speed. In 2026, PMOs need dashboards that adapt to how work is executed, not tools that force rigid workflows.
Microsoft Power Apps supports this by allowing dashboards to be built around real project needs and updated as requirements change.
Power Apps remains relevant because it enables:
- Configurable project views
Dashboards can be tailored to show milestones, task status, resource allocation, and budget indicators based on how teams manage delivery. - Faster updates as needs change
As projects scale or delivery models shift, dashboards can be adjusted without full rebuilds or long development cycles. - Role-based visibility and access
Project managers, PMOs, and executives see the information relevant to their roles without separate systems. - Growth from basic to advanced dashboards
Teams can start with simple tracking and add analytics, automation, and cross-project views over time. - Alignment with existing Microsoft workflows
Dashboards connect with tools teams already use, improving adoption and daily usage.
In 2026, dashboard effectiveness depends on how well it supports timely decisions. Power Apps remains a strong choice because it allows organizations to build dashboards that adapt to project execution and scale as needs grow.
What are The Limitations of Traditional Project Management Dashboards?
Traditional project management dashboards were built for a time when visibility was enough. If teams could see task lists, timelines, and status indicators, project managers were expected to interpret the data and act. In 2026, that no longer holds.
Projects now span multiple teams, tools, and time zones, with frequent changes in scope, priorities, and resources. Dashboards that rely on static views and manual navigation add cognitive load and slow decision-making.
Common limitations of traditional PM dashboards include:
- Too much focus on static status
Dashboards show where things stand, but not why they changed or what needs attention. - Manual interpretation of risks and delays
Project managers must identify patterns and bottlenecks themselves, often after issues appear. - Reactive insights
Problems are flagged after timelines slip or budgets are affected, not earlier. - High reporting overhead
Dashboards require manual updates, duplicate entries, and time spent preparing reports. - Limited prioritization support
When everything is visible, it is harder to decide what needs action and what can wait.
These gaps do not make dashboards irrelevant. They show the need to change how dashboards work. In 2026, project managers need dashboards that do more than display information. They must help focus attention, reduce noise, and support faster decisions as projects change.
Build a Dashboard That Reflects How Your Projects Actually Run
Modern project management dashboards should do more than report status. They should surface risks early, clarify priorities, and support faster decisions. See how a Power Apps–based dashboard can be designed around your delivery model and execution needs.
Request a DemoWhat a Modern Project Management Dashboard Includes in 2026?
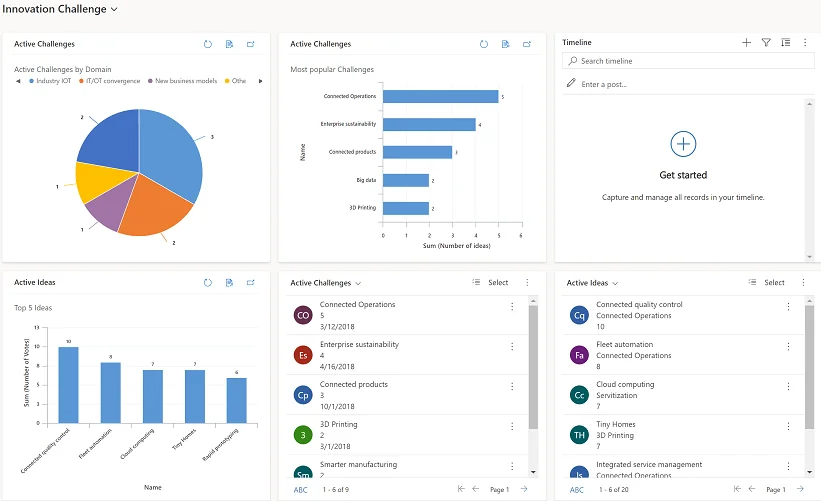
A modern project management dashboard in 2026 is not defined by the number of filters or screens. Its value comes from how well it helps project managers understand delivery health, identify risks early, and act quickly. The dashboard remains the central control point, but it focuses on meaning rather than just data.
At a minimum, it brings together three layers: operational visibility, analytical insight, and execution context.
1. Core Operational Visibility
This is the foundation of any dashboard. Project managers need clear access to:
- Project and milestone status
Current phase, upcoming milestones, and overall progress. - Task execution and dependencies
What is complete, in progress, or blocked, including dependencies. - Resource allocation and workload
Who is assigned where, capacity limits, and over-allocation risks. - Budget tracking and financial signals
Planned vs actual spend, cost trends, and early budget risks.
This information must be accurate, up to date, and easy to scan.
2. Analytical Signals That Go Beyond Status
Modern dashboards go beyond the current state and show direction.
This includes:
- Trend visibility over time
How schedules, effort, and costs are changing. - Variance and exception highlighting
Clear signals when timelines, scope, or resources deviate. - Cross-project patterns
Recurring bottlenecks, risks, or capacity issues across projects.
These analytical views are often supported by tools like Microsoft Power BI, shifting dashboards from static views to insight-based monitoring.
3. Execution Context for Better Decisions
Context separates modern dashboards from legacy tools. Project managers need to know not just what is happening, but why it matters.
A well-designed dashboard provides:
- Clear ownership and accountability
Who is responsible for each project, task, or risk. - Recent changes and activity awareness
What has changed since the last review, and where attention is needed. - Focused attention cues
Signals that help prioritize actions instead of reviewing every metric.
This reduces noise and supports faster decisions.
A project management dashboard works when it helps teams move from insight to action. By combining visibility, analysis, and context in one place, it remains the source of truth while becoming more effective for delivery control.
Build a Dashboard That Reflects How Your Projects Actually Run
Modern project management dashboards should do more than report status. They should surface risks early, clarify priorities, and support faster decisions. See how a Power Apps–based dashboard can be designed around your delivery model and execution needs.
Request a DemoHow to Make Project Management Dashboards Easier to Use Without Adding More Screens?
As dashboards become more detailed, usability becomes a challenge. Adding more views and reports can improve visibility, but it also adds friction. Now the focus is not on adding more screens, but on making dashboards easier to use in daily work.
Modern dashboards handle this by separating what the dashboard contains from how project managers interact with it. The dashboard remains the system of record, while interaction becomes simpler and faster.
This is where Microsoft Copilot Studio plays a supporting role.
Copilot does not replace dashboards. It serves as an interaction layer that helps project managers access and understand information more quickly.
Copilot supports modern PM dashboards by enabling:
- Natural-language access to dashboard insights
Project managers can ask for status summaries, recent changes, or risks without navigating multiple views. - Faster interpretation of complex data
Instead of reviewing multiple charts, PMs get concise summaries based on existing data. - Less navigation and context switching
Key insights are surfaced without leaving the dashboard or adding new screens. - Use of existing data and security models
Copilot uses the same data, permissions, and analytics as the dashboard.
The dashboard still remains central. Project managers rely on structured views for planning, tracking, and detailed analysis. Copilot reduces the effort needed to get answers, especially when time is limited.
In practice, dashboards remain the foundation for project control, while Copilot reduces friction in accessing and understanding information. This supports faster decisions without changing the underlying structure.
How Are Project Management Dashboards Moving from Static Reporting to Proactive Signals?
One of the key shifts in 2026 is the move from static reporting to proactive signaling. Traditional dashboards require project managers to manually check status, compare metrics, and identify issues. Modern dashboards built with Microsoft Power Apps reduce this effort by focusing attention on what needs action.
Power Apps supports this by embedding project logic, thresholds, and execution context directly into the dashboard. Instead of only displaying data, the dashboard reflects when conditions change and when action may be required.
Power Apps–based dashboards surface signals such as:
- Schedule slippage indicators
When tasks or milestones start drifting from timelines, the dashboard flags it early so teams can respond before delays grow. - Resource strain and capacity limits
Highlights when individuals or teams are over-allocated, allowing earlier workload adjustments. - Budget variance trends
Shows emerging cost patterns that may lead to overruns, not just past spend. - Dependency and bottleneck visibility
Identifies where approvals, dependencies, or blocked tasks are slowing progress.
Because these signals are built into the dashboard, project managers do not need separate reports or manual checks to spot issues. The dashboard directs attention to where it is needed.
This does not replace detailed reporting. Power Apps dashboards still provide access to underlying data and deeper views when needed. What changes is the starting point. Instead of reviewing every metric, project managers are guided to what matters most at that moment.
How are Modern Project Management Dashboards Built and Where Does Copilot Fit?
Building a modern project management dashboard is less about adding screens and more about creating a system that supports visibility, insight, and action. While implementations vary, effective dashboards follow a clear, execution-focused approach.
At a high level, they are built by:
- Structuring project data clearly
Projects, tasks, resources, milestones, and budgets are organized to support reporting, analytics, and role-based access without duplication. - Designing views around execution needs
Dashboards focus on delivery health, risks, and priorities, instead of listing raw data. - Adding proactive signals and thresholds
Schedule drift, resource strain, and budget variance are defined to flag issues early. - Embedding dashboards into daily workflows
Dashboards are placed where project managers already work to improve adoption and consistent use.
Where Copilot Fits?
Once this foundation is in place, Copilot can be added as an interaction layer. It does not change how the dashboard works, but it helps project managers use it more efficiently by summarizing status, surfacing changes, and answering questions using existing data.
This reduces effort while maintaining structured views, security, and governance.
At this stage, the difference between a basic dashboard and a high-impact one comes down to how well it fits real project workflows. It requires a clear understanding of delivery processes, data structure, and change management.
Move from Status Updates to Action-Oriented Dashboards
Tracking progress is not enough. Create a dashboard that highlights what needs attention and helps teams act quickly.
Request a DemoConclusion
Project management dashboards are becoming more central to how delivery is managed, risks are handled, and resources are allocated. In 2026, effective dashboards balance clear visibility with context and ease of use.
By shifting from static reporting to proactive execution support, organizations can reduce manual effort, identify risks earlier, and improve decision-making across project teams. Power Apps provides the foundation for this shift, while Microsoft Copilot improves how project managers access and use insights without changing existing workflows.
The dashboard remains the control point. What has changed is how well it supports the people responsible for delivery.
FAQs
Power Apps uses Microsoft Dataverse and integrates with Microsoft security models. Access can be controlled at the user, role, and data levels, ensuring only authorized users see specific project information.
Yes. Power Apps can scale when supported by a robust data architecture and integrated with tools such as Microsoft Dataverse and Microsoft Power BI for reporting and performance optimization.
They can connect with tools like Microsoft Project, Microsoft Teams, and other third-party systems through APIs and connectors, allowing unified project visibility.
Timelines vary based on complexity. A basic dashboard can be built in a few weeks, while enterprise-level solutions with integrations and analytics layers may take several months.
Data accuracy depends on proper integration, validation rules, and governance. Using a centralized data source, such as Microsoft Dataverse, reduces duplication and inconsistencies.