What-if analysis lets you change key variables in your data to see how outcomes shift under different conditions. It helps teams test scenarios, plan for uncertainty, and make decisions based on measurable impact instead of assumptions.
In business settings, this approach is used to:
Evaluate pricing and revenue scenarios
Forecast demand and resource needs
Assess risk under changing conditions
Support faster, data-backed decisions
This blog covers common business use cases and shows how to implement what-if analysis in Microsoft Power BI using an electricity demand and consumption dataset.
You will also see how what-if parameters and DAX measures work together to model scenarios, from simple adjustments to more advanced analysis.
What Are the Common Use Cases of What-if Analysis in Power BI?
What-if analysis in Microsoft Power BI is used across different business functions to evaluate scenarios, reduce uncertainty, and plan outcomes based on changing variables:
1. Predictive Analytics and Advanced Business Modeling:
The most common application of what-if analysis in Power BI is to generate future data based on existing data. In this way, businesses can model future possibilities.
For example, a construction-based company may need to
Estimate project costs based on changes in labor, materials, or timelines
Forecast demand using seasonal or external factors
Model financial outcomes before committing resources
By generating data for the future, businesses can make predictions and take action accordingly.
2. Scenario Analysis for Uncertainty Management:
Teams use what-if analysis to test multiple scenarios and understand how different factors affect outcomes under uncertain conditions.
Compare best-case, worst-case, and expected scenarios
Assess the impact of external events like market shifts or disruptions
Evaluate operational risks before making decisions
3. Goal Seeking Analysis:
What-if analysis in Power BI also helps businesses and organizations manage and achieve goals. It helps businesses find various factors that can help them reach their goals.
For example, a retail chain can:
Adjust pricing or discounts to meet revenue goals
Identify the sales volume needed to hit targets
Test different strategies to achieve operational KPIs
What-if Analysis in Power BI for Electricity Demand and Consumption Dataset
Implementing what-if analysis in Power BI is very convenient and can be broadly achieved in two steps:
Setting up What-if Parameters
Using those parameters inside Data Analysis Expressions (DAX) measures to transform the data.
Scenario: Electricity Demand and Supply Analysis:
Consider a dataset that tracks daily average electricity demand and supply. The goal is to identify when demand may exceed supply based on changing conditions.
With this setup, you can:
Simulate increases or decreases in demand
Adjust supply assumptions
Identify potential shortages before they occur
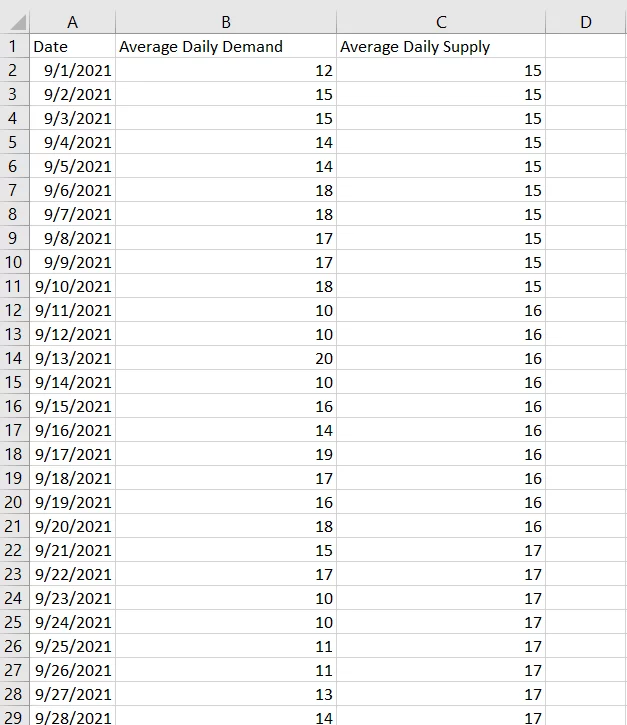
For illustrative purposes, assume a dataset containing daily demand and supply values.
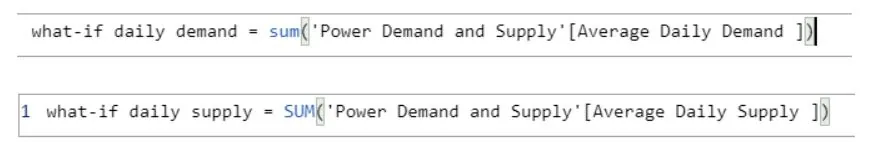
After loading the data into Power BI, the first step is to create DAX measures to calculate total daily demand and supply.
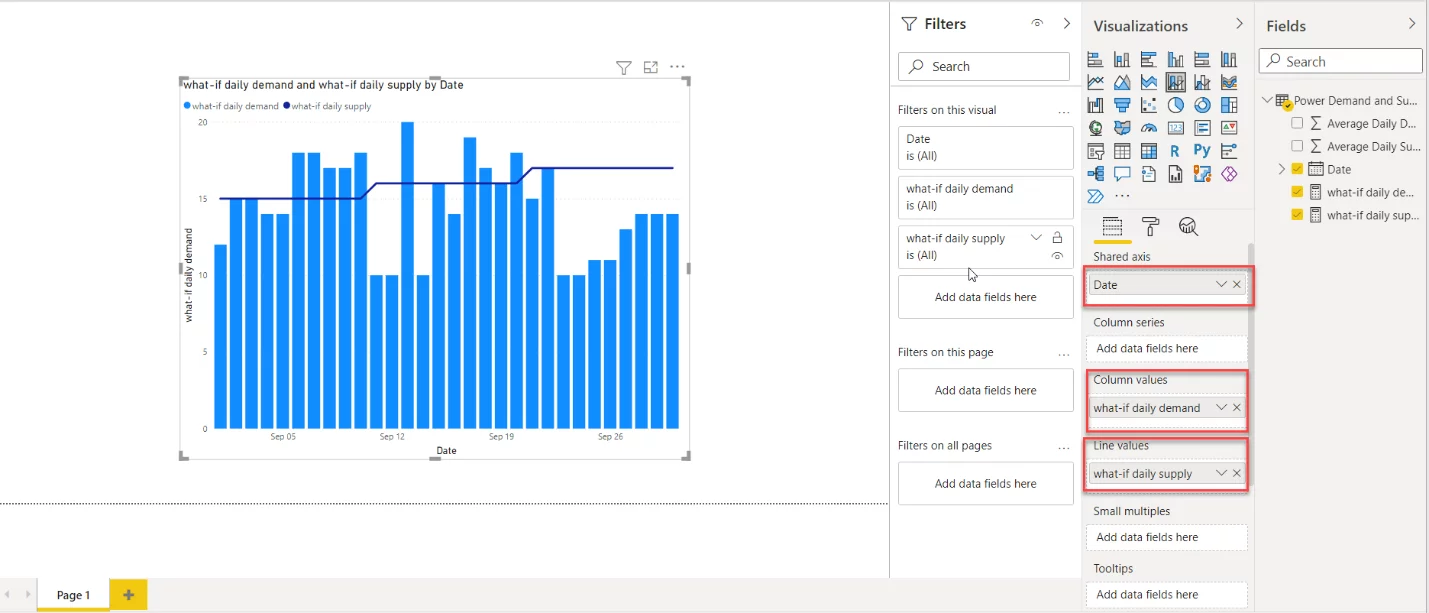
After plotting the data, we can customize the visual per our preferences.
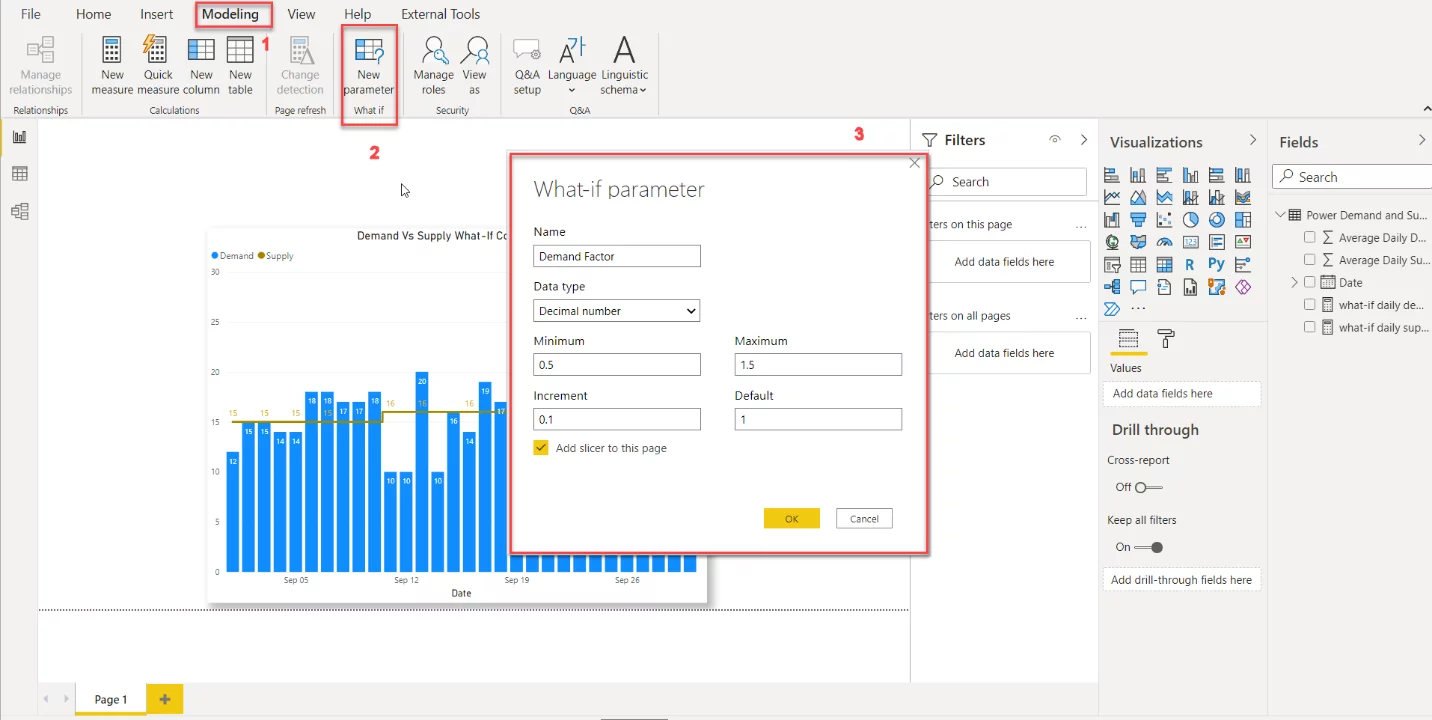
The next step is to create a ‘What-if parameter’ to model fluctuations in the electricity demand. For this, follow these steps:
Select the “Modeling” tab and click “New Parameter.”
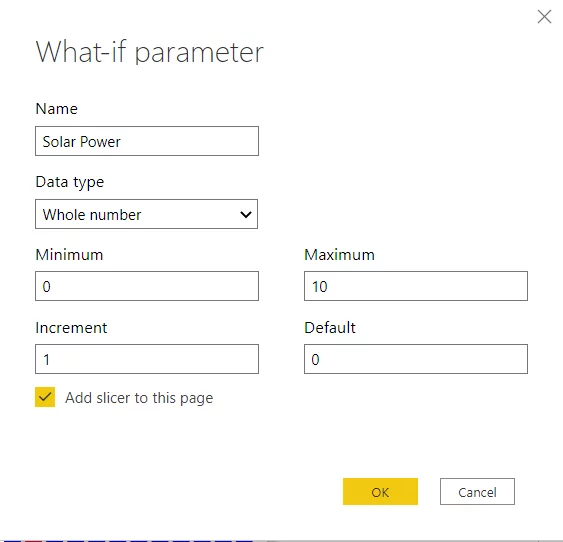
Then, provide the range of values the ‘What-if parameter’ can take, the increment, and the default value, as shown below:
After setting up the What-if parameter, the next step is to incorporate this parameter into the “What-if daily demand” measure we created earlier. In this way, we can simulate fluctuations in power demand using the What-if parameter.
The edited measure is shown below:
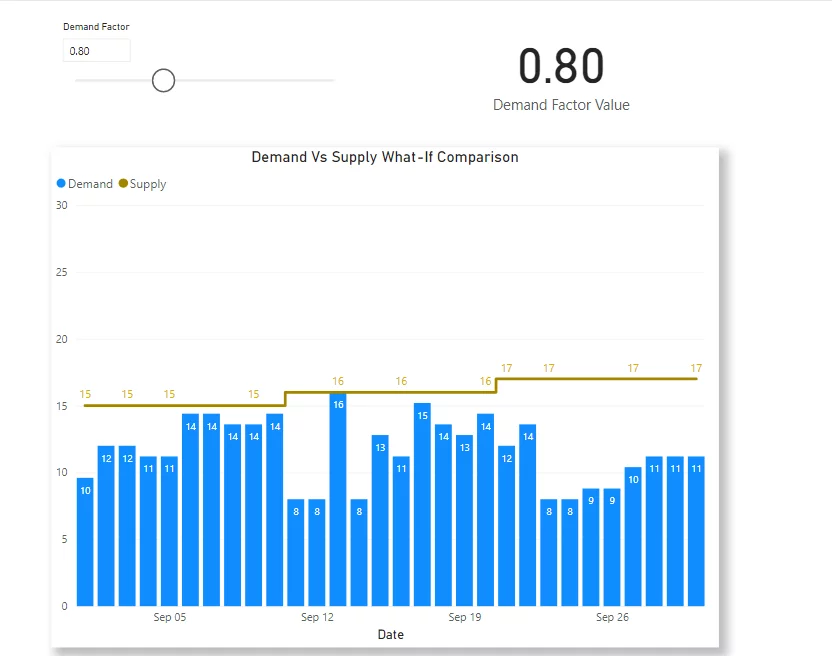
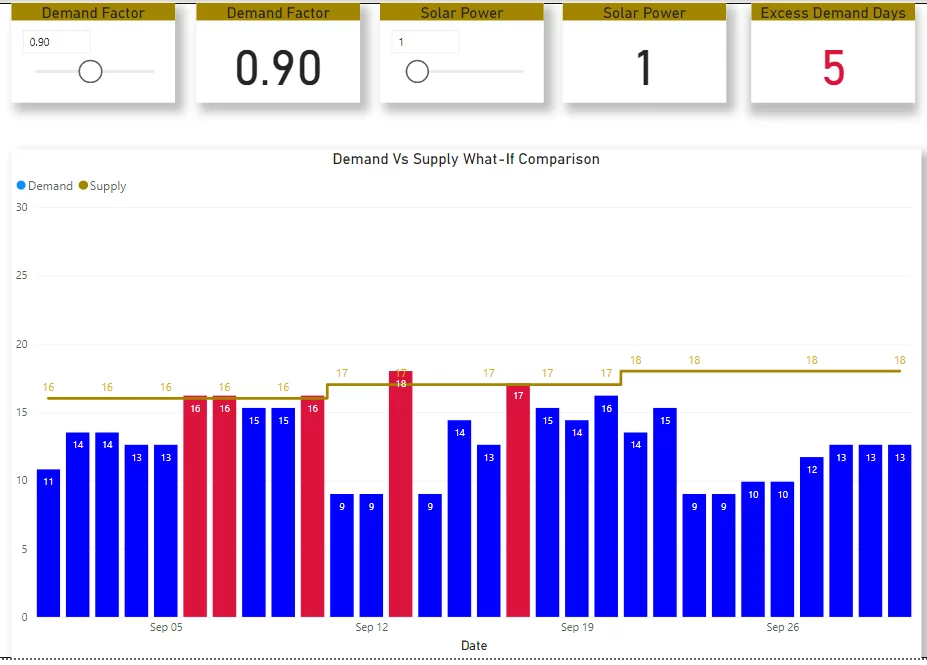
Now, we can change the value of the What-if parameter, which will change the daily demand data. Further, we can also place the What-if parameter inside a “Card” to confirm its value, as shown below:
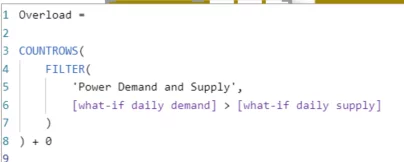
Now, we can use conditional formatting to highlight the days in the visualization where electricity demand exceeds supply. We can do this by first writing a DAX measure that checks days where the demand is greater than the supply:
Then, we can assign a specific color to both of these cases, as shown below:
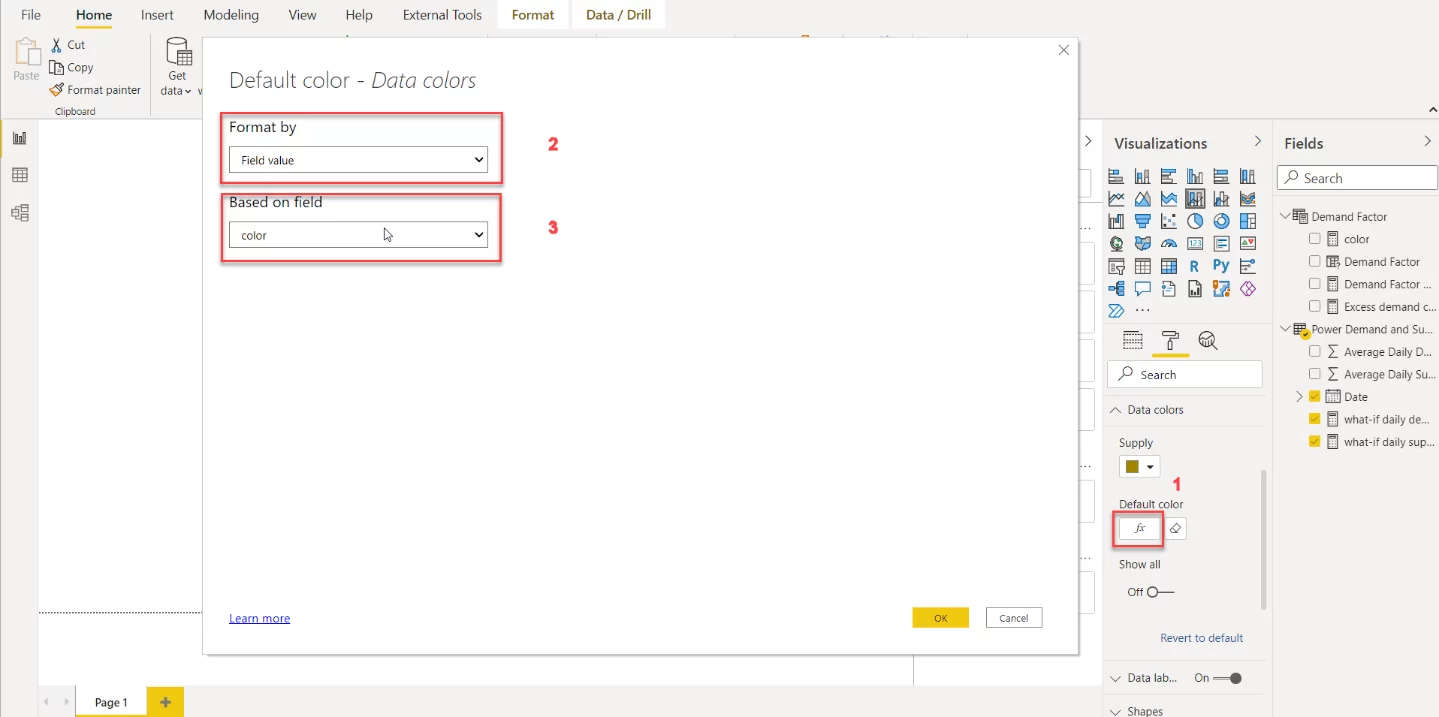
Next, while we have the “line and stacked column chart” visual selected, we click the “fx” sign underneath the “default color,” then select “Field value,” and finally, select the above-created measure from the drop-down menu, as shown below:
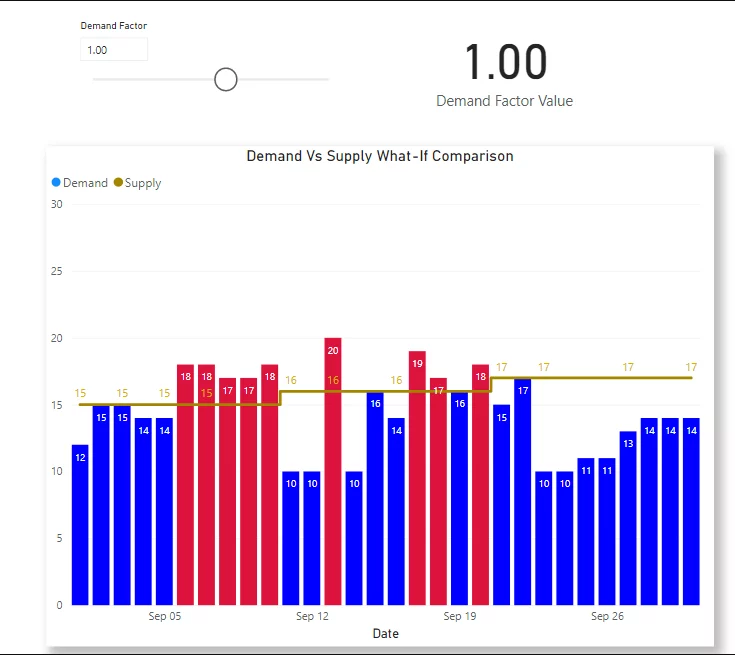
As we can see below, for days where the demand exceeds the supply, the bar will be crimson (#DC143C):
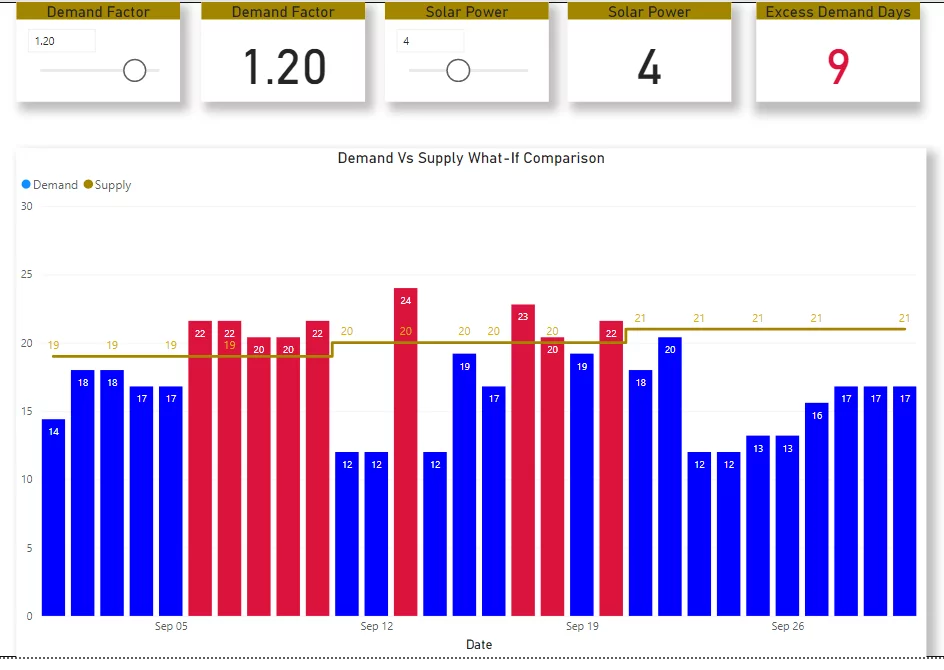
Similarly, we can incorporate variability in the electricity supply. Let us assume we also have additional power from solar panels. We can make another What-if parameter, “Solar Power,” and incorporate this into the “What-if daily supply” parameter.
What-if analysis in Microsoft Power BI helps teams evaluate scenarios, test assumptions, and make better decisions with greater clarity. It applies across forecasting, risk assessment, and performance planning.
Its implementation is straightforward. Once combined with DAX, it allows you to adjust variables, simulate outcomes, and analyze complex business scenarios without changing the underlying data.
FAQS
How do you choose the right variables for what-if analysis in Power BI?
Focus on inputs that directly influence outcomes, such as pricing, demand drivers, or cost components. Start with variables that decision-makers frequently adjust.
Can what-if analysis handle real-time or streaming data in Power BI?
Yes, but it depends on your data setup. With connected data sources and scheduled refreshes, you can apply what-if parameters to near-real-time datasets.
What is the difference between what-if parameters and calculated columns in Power BI?
What-if parameters allow dynamic user input, while calculated columns are static and computed during data load. Parameters are better for interactive scenario testing.
How do you validate the accuracy of what-if scenarios?
Compare results with historical data, test against known outcomes, and involve business stakeholders to confirm assumptions behind each variable.
Can what-if analysis be shared with non-technical users?
Yes. You can publish reports with slicers and visuals so business users can adjust parameters without writing DAX.
What are the common limitations of what-if analysis in Power BI?
It depends on data quality, model design, and assumptions. Poor data or unrealistic inputs can lead to misleading conclusions.
To provide the best experiences, we use technologies like cookies to store and/or access device information. Consenting to these technologies will allow us to process data such as browsing behavior or unique IDs on this site. Not consenting or withdrawing consent, may adversely affect certain features and functions.
Functional
Always active
The technical storage or access is strictly necessary for the legitimate purpose of enabling the use of a specific service explicitly requested by the subscriber or user, or for the sole purpose of carrying out the transmission of a communication over an electronic communications network.
Preferences
The technical storage or access is necessary for the legitimate purpose of storing preferences that are not requested by the subscriber or user.
Statistics
The technical storage or access that is used exclusively for statistical purposes.The technical storage or access that is used exclusively for anonymous statistical purposes. Without a subpoena, voluntary compliance on the part of your Internet Service Provider, or additional records from a third party, information stored or retrieved for this purpose alone cannot usually be used to identify you.
Marketing
The technical storage or access is required to create user profiles to send advertising, or to track the user on a website or across several websites for similar marketing purposes.